PV column
consulting
2025/04/21
Japan’s population trends and the domestic PV system market
On April 14, 2025, the Statistics Bureau of the Ministry of Internal Affairs and Communications announced a summary of the results of population estimates (as of October 1, 2024) https://www.stat.go.jp/english/data/jinsui/2024np/index.html. The total population decreased by 550,000 (the 14th consecutive year of decline), and the unfortunate situation is that the rate of decline in the Japanese population has been increasing for 13 consecutive years.
Meanwhile, energy news in Japan is full of a variety of topics, including subsidies to reduce the impact on living costs and the expansion of decarbonization efforts. There are concerns about how Japan’s declining population, a major issue, will affect the installation of PV systems and energy storage facilities, and whether the declining population is also linked to the aging of technicians who are knowledgeable about repairing and updating existing power generation facilities.
In this column, we analyze statistical data on Japan’s domestic PV system market from 2010 to 2024 and its relationship to Japan’s population trends.
Table 1. PV module shipment to Japan, residential use, production, and new housing starts:
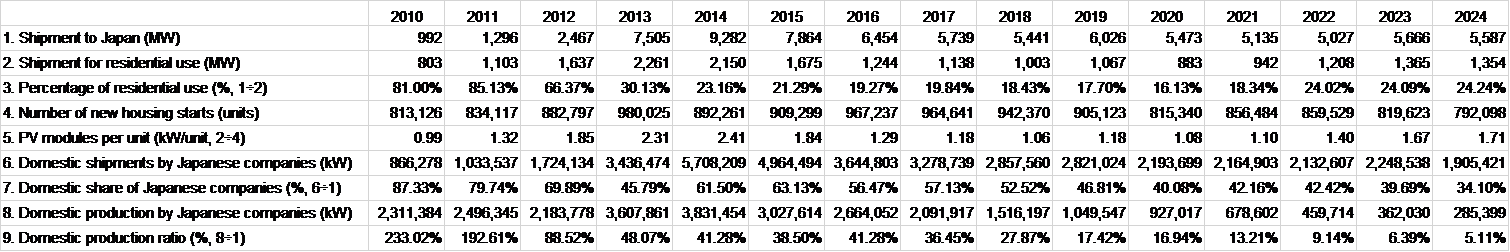
Relevant data extracted from the Ministry of Land, Infrastructure, Transport and Tourism’s Construction Starts Statistics Report (2024 total) dated January 31, 2025 .
1. Trends in shipments to Japan:
Although the amount of PV systems installed has increased since 2012 when the Feed-in Tariff (FIT) scheme began, it has remained almost flat since 2016 until 2024. In countries around the world, the installation of PV systems is progressing as the most cost-competitive power source due to the rising cost of electricity, the falling cost of solar panels, and the benefits of higher output. In Japan, the cost of self-consumption PV systems may be advantageous regardless of whether or not there is a subsidy, when comparing electricity bills, but looking at market trends, it seems that growth is sluggish.
2. Trends in shipments for residential use and 3. Proportion:
In 2010 and 2011, before the start of the Feed-in Tariff (FIT), residential use exceeded 80%, and PV system was synonymous with installation in homes. With the introduction of the Feed-in Tariff (FIT) in 2012, PV systems became an easy-to-understand investment target, which led to significant market growth and a sharp decline in the share of the residential PV system market. Industrial and business use was approximately 80% and residential use was approximately 20%, but from 2022 to 2024, the share of residential use is expected to increase slightly to 24%, with only a slight increase in the amount of installation.
Figure 1. Trends and percentages of shipments to Japan and residential use:
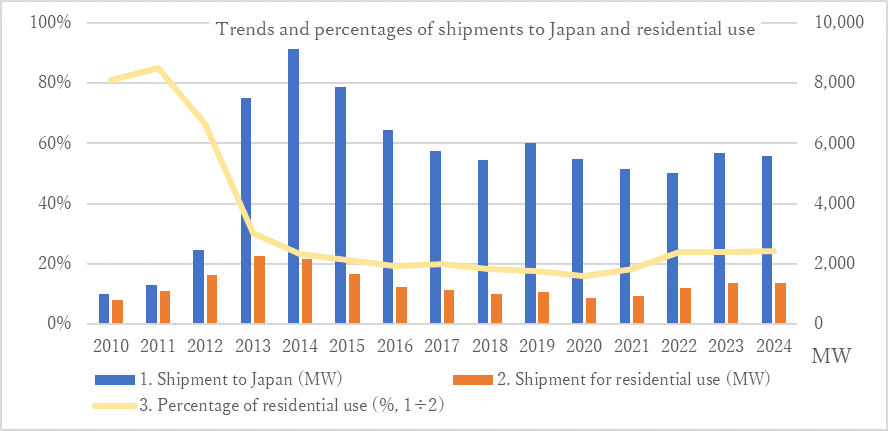
The installation of PV systems is expanding smoothly in Germany, with the installed capacity expected to reach 17.3GW in 2024 (according to market data from the German Photovoltaic Energy Association (BSW-Solar)), approximately three times that of Japan, and it appears that more than 80% of residential installations are being installed with energy storage systems. In addition, there is a shortage of construction companies to install PV systems compared to demand, and there are some areas where people have to wait more than six months for their turn.
4. Number of new housings starts and 5. PV module capacity per unit:
To evaluate residential PV system, we used construction start statistics from the Ministry of Land, Infrastructure, Transport and Tourism. There are far more existing homes than new homes, but when it comes to installing new PV systems, we compared the correlation with the number of new housings starts in order to analyze the trend.
Looking at the period from 2012, when the Feed-in Tariff (FIT) scheme was launched, to 2015, the amount of PV systems installed for residential use was divided by the number of all new homes to convert the capacity per home, resulting in an outstanding capacity of 1.8-2.4kW. Because the selling price at the time of full purchase was high, it is assumed that there were sales of homes that could sell all of their electricity for business use by installing many PV systems, rather than the system of selling surplus electricity for 10 years that is used for residential purposes. The dramatic increase in the number of new housings starts in 2013 may have been influenced by the installation of the PV systems purchase scheme. Except for 2013, there does not appear to be a correlation between PV systems and the number of new housings starts, and PV systems may not have been enough to stimulate residential demand from individuals.
Since residential PV system is expected to increase slightly from 2022 onwards, it may be that there is a gradual increase in demand for not only new installations but also the renewal of aging equipment, and people who are interested in energy storage systems and electric vehicles. Since it seems that the installation of PV systems and energy storage systems may be something familiar, this data makes us feel that we should work hard to explain the advantages and disadvantages of installation and how to use them.
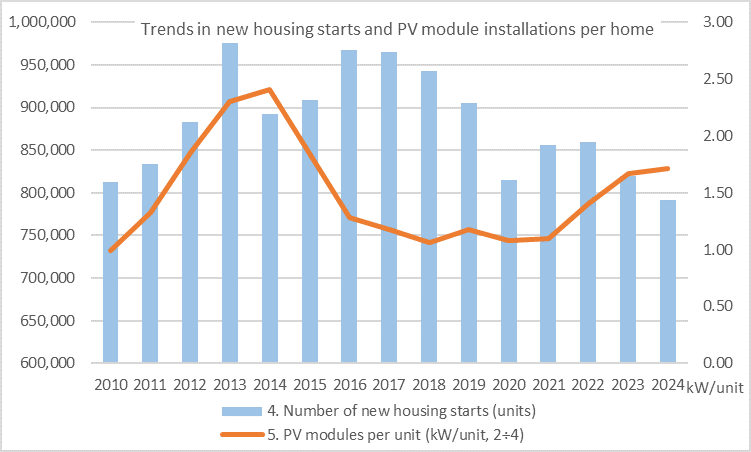
Figure 2. Trends in new housing starts and PV module installations per home:
6 & 7. Domestic shipment, market share of Japanese companies, 8 & 9. Domestic production and market share in Japan:
Until 2011, before the FIT scheme was launched, the share of Japanese PV module manufacturers was nearly 80%, almost the same as that of residential use. However, since 2012, when the share of commercial use expanded significantly, the share of Japanese manufacturers has been declining year by year from 63% to 34% from 2015 to the present.
Looking at domestic production by Japanese manufacturers, it is assumed that production volume was greater than the size of the Japanese market until 2011, and that Made in Japan PV modules were exported to Europe and other overseas markets.
Despite the significant expansion of the Japanese market, Japan’s domestic production ratio has continued to decline almost every year for the 15 years from 2010 to 2024, with domestic production in 2024 being 285MW, and 95% of the PV modules in the Japanese market being made overseas.
Although some domestic bases are selling to the domestic market, it appears that not only is it difficult to maintain sales volume in the Japanese market, but it has also been difficult to keep up with competition in huge overseas markets.
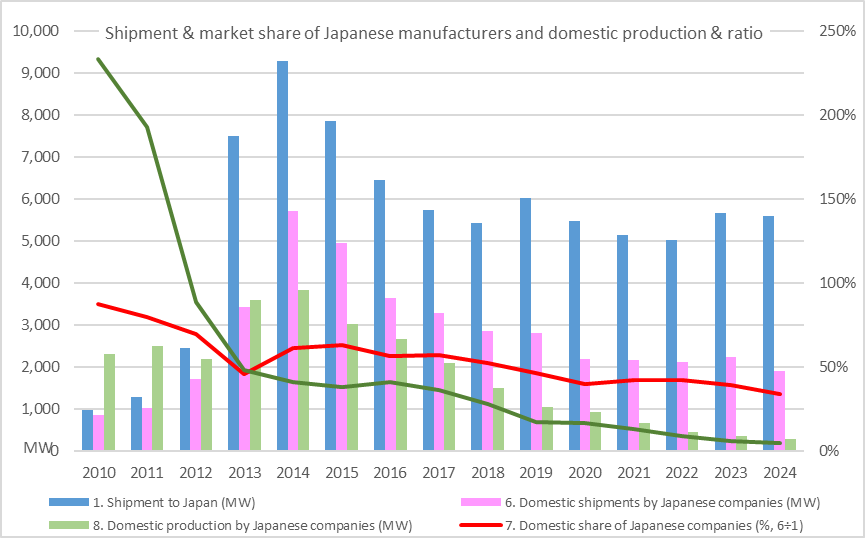
Figure 3. Changes in shipment volume and market share of Japanese manufacturers, and domestic production volume and production ratio:
10 – 14. Japanese population, trends in the Japanese population aged 25-64 and related indicators:
The Statistics Bureau of the Ministry of Internal Affairs and Communications has reported that the Japanese population continues to decline every year, and has also published data on the employed population for those aged 15 to 64. Based on our own experience, we have calculated the Japanese population of those aged 25-64, as this is the age group that is most likely to purchase PV system.
Table 2. Japanese population, Japanese population aged 25-64, PV module capacity per capita, and number of new housings starts:

Calculated by our company by combining shipment statistics data from the Japan Photovoltaic Energy Association (JPEA) and relevant data from the Ministry of Land, Infrastructure, Transport and Tourism’s Construction Starts Statistics Report (2024 total).
Over the 15 years from 2010 to 2024, Japan’s population decreased by approximately 5.9 million, from 126.4 million to 120.52 million. This is an average annual decrease of approximately 420,000 (-0.33%). Meanwhile, during the same period, Japan’s population between the ages of 25 and 64 decreased by approximately 8 million, from 67.66 million to 59.69 million. The decrease in the Japanese population aged 25-64 is greater than the overall Japanese population, with an average annual decrease of approximately 570,000 (-0.84%), indicating that the population is decreasing while the population is aging.
Looking at the trends in the PV system installation and the amount of PV system for residential use among the Japanese population aged 25-64, there has been no particularly large change in the most recent amount installed per person. However, compared to 2010 and 2011, before the start of the FIT, the figures have increased significantly since 2012, which suggests that PV system has become firmly established with FIT.
When we calculated the number of new housings starts per Japanese person aged 25-64, we found that the figure remained consistent at 0.012-0.015 over the 15 years from 2010 to 2024. It seems that the increase in the Japanese population aged 25-64 will have the greatest impact on market expansion.
Figure 4. Trends in the Japanese population (aged 25-64) and domestic PV module (shipment/production volume) from 2010 to 2024:
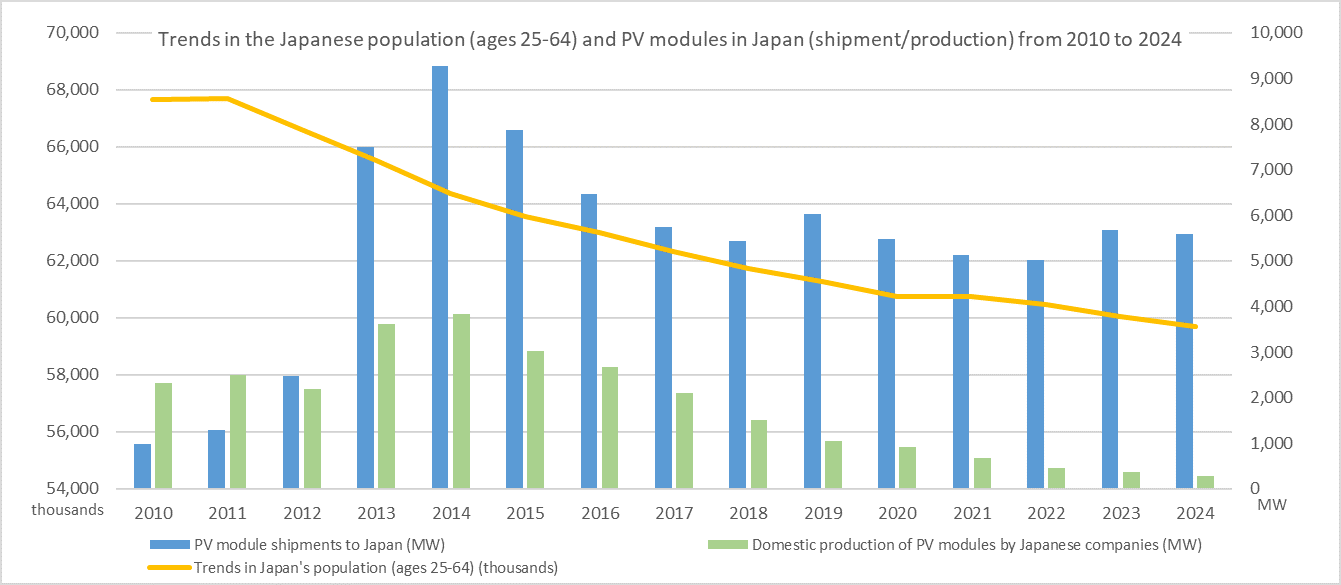
Both the amount of PV module production in Japan and the Japanese population aged 25-64 have declined over the past 15 years. These may seem like a tough 15 years, but as the amount of renewable energy installation around the world has increased, not only has the amount of production increased, but new business models and jobs have also been created.
We believe that Japanese companies will be able to overcome the headwinds in the Japanese market and create a variety of products, services, and business models that will contribute to the development of infrastructure not only in Japan but also around the world.