PV column
consulting
2025/02/01
“Climate Action Dashboard” by OECD
The Organisation for Economic Co-operation and Development (OECD), which has 38 member countries including Japan, publishes statistical data on greenhouse gas reduction and global warming.
In this column, we will provide an overview of the Climate Action Dashboard and introduce data on renewable energy.
The table of contents and link to the Climate Action Dashboard are provided at the end of this column, so please take a look if you are interested.
Source: https://www.oecd.org/en/data/dashboards/climate-action-dashboard.html
**********
Climate Action Dashboard
The Climate Action Dashboard features key indicators used to track progress towards climate objectives and provide a snapshot of country climate action. The Dashboard is built around four key components based on the pressure-state-response (PSR) model of environmental indicators (Climate Action Monitor 2023). It begins with pressures and drivers considering trends in greenhouse gas (GHG) emissions and the status of mitigation commitments presented in Nationally Determined Contributions (NDCs). It describes the evolution activities and sectors that drive emissions. It monitors the state of the climate and environment by presenting indicators on risks and vulnerabilities, particularly climate-related hazards. Finally, it covers national responses by monitoring policies and actions aimed at mitigating and adapting to climate change.
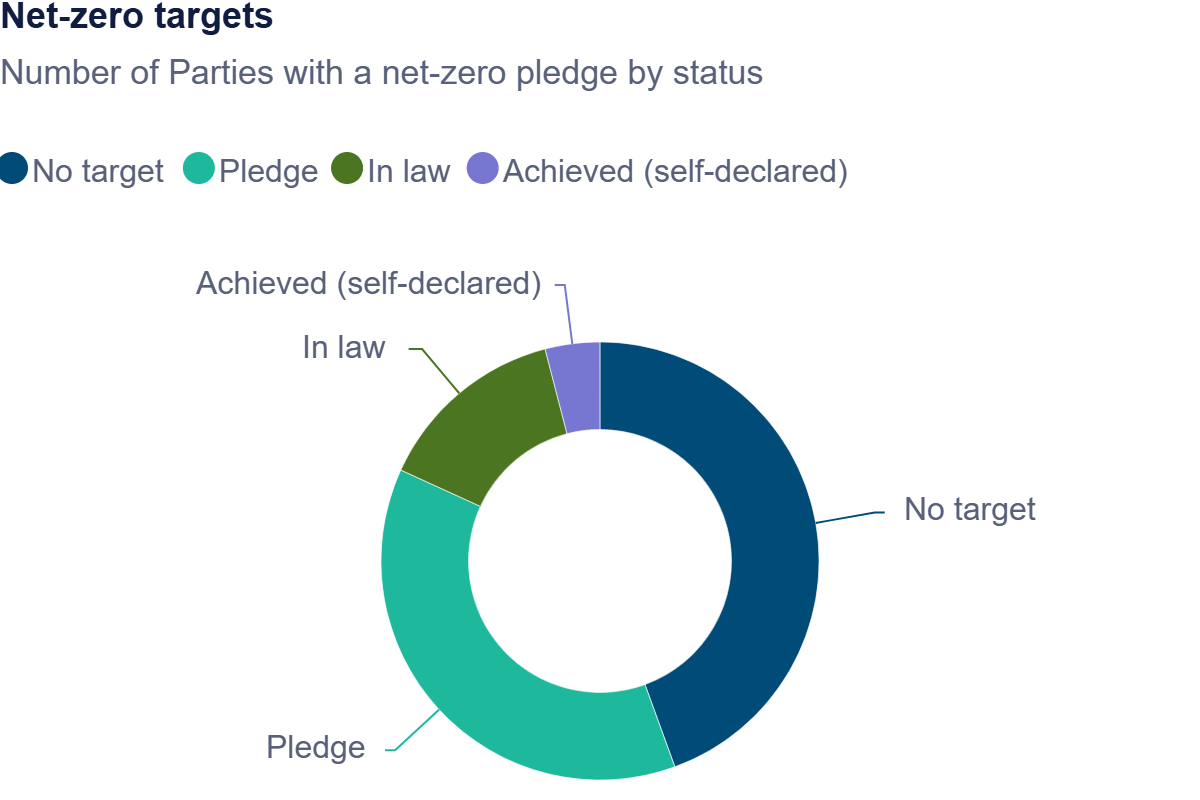
Net-Zero
As of July 2024, 110 countries have pledged a net-zero target, with 96 aiming to reach this target by 2050 or before. However, most targets are not legally binding. Net-zero targets cover approximately 88% of global GHG emissions, but only 27 countries and the European Union, representing 16% of global GHG emissions, have enshrined these targets into law.
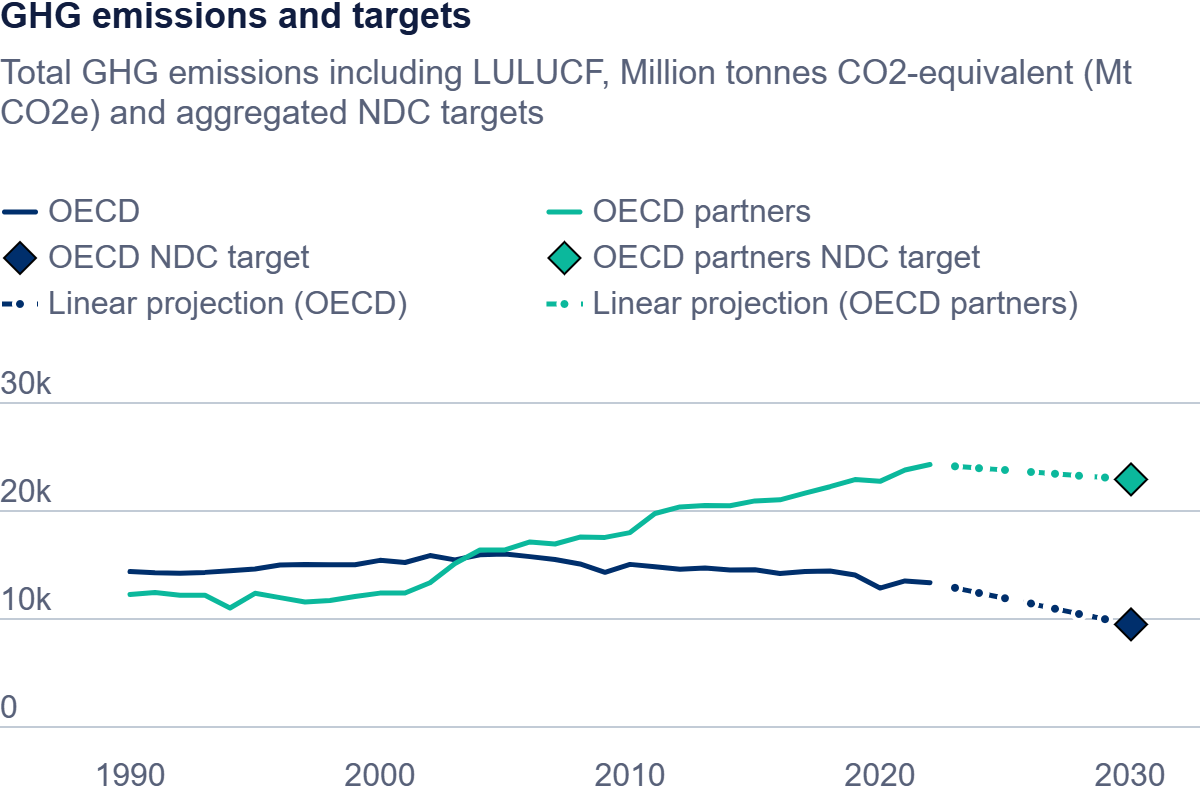
GHG Emissions and targets
To limit global warming to 1.5°C by the end of this century, total GHG emissions must decline by 43% by 2030 compared to 2019 levels according to IPCC estimates. This means that countries would need to tighten their respective climate targets considerably. Currently, OECD members and partner countries have committed to reduce their emissions by 29% and 5.7%, respectively, compared to 2022 levels.
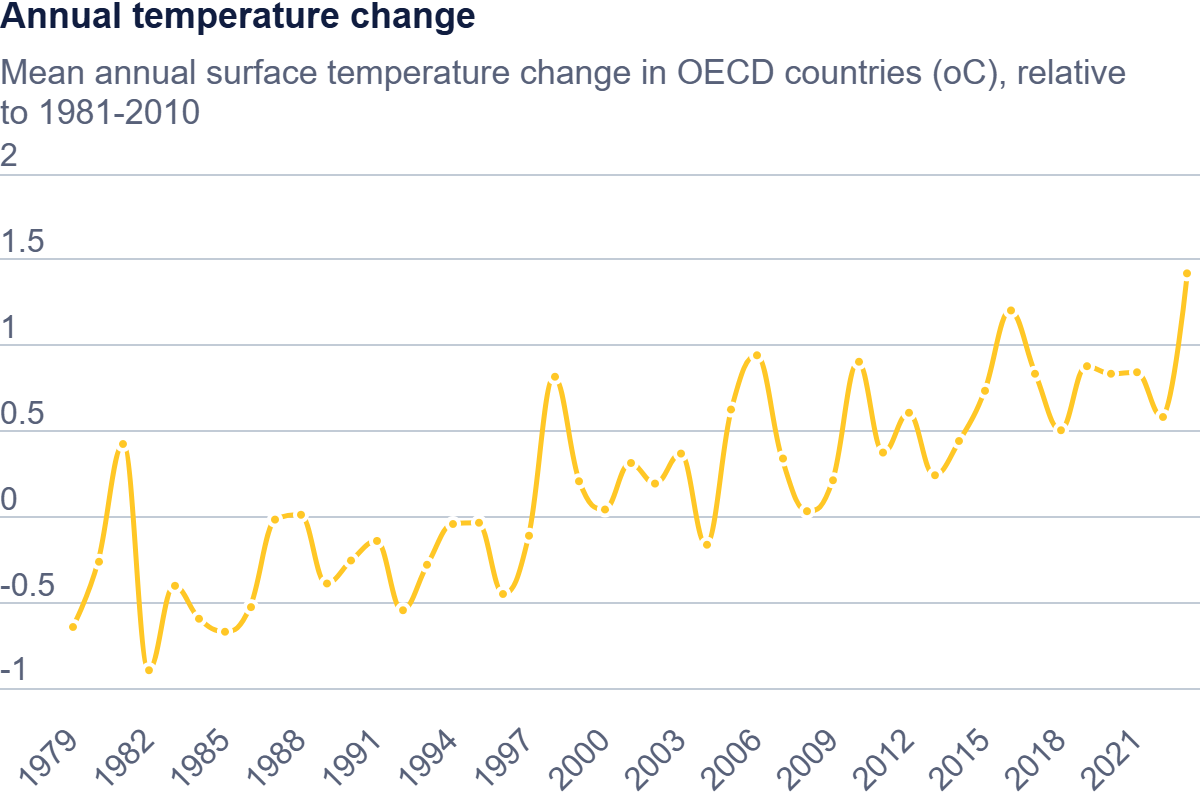
Annual Temperature Change
Annual surface temperatures across the globe have risen over the past decades. In 2023, the world experienced its hottest year on record, with global surface temperatures 0.6deg-C above the 1991-2020 average, leaving half a billion more people exposed to days with maximum temperatures exceeding 35deg-C. Furthermore, 2024 is on track to set new records for global warming, with 15 national heat records already broken as of August 2024.
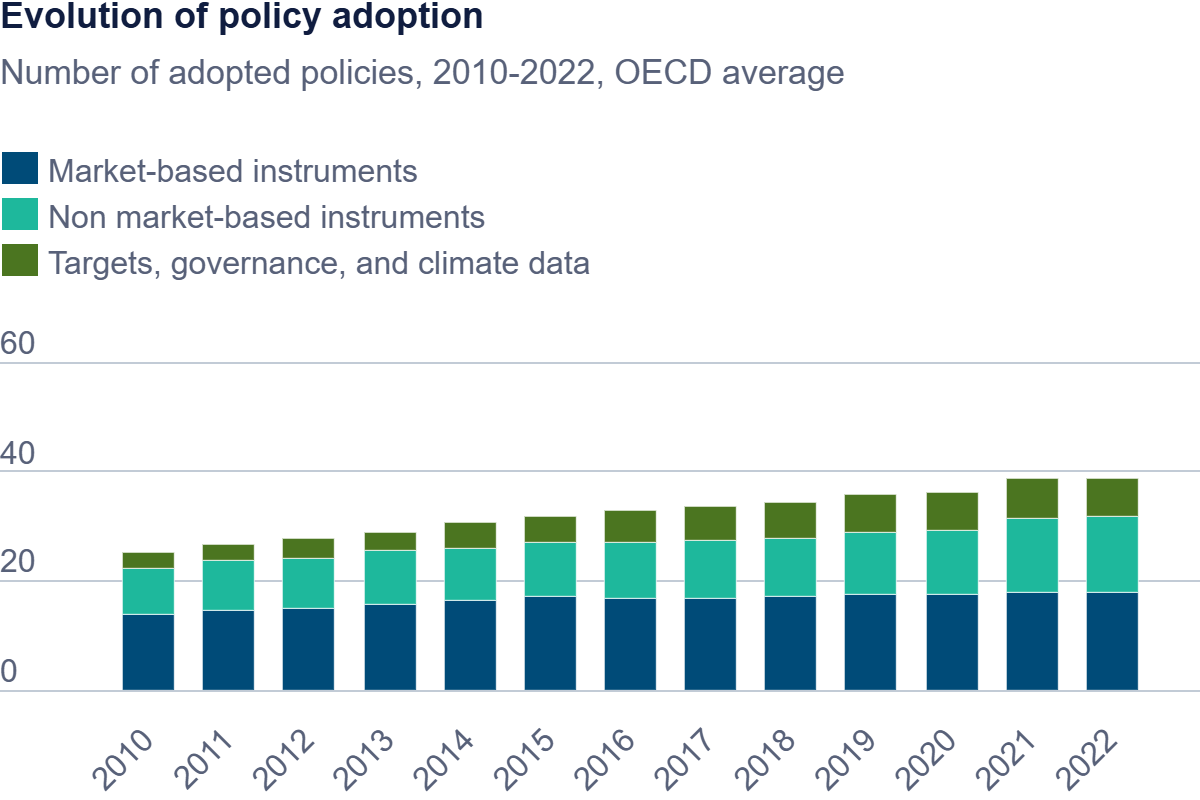
Climate mitigation policies
According to the IPAC Climate Actions and Policies Measurement Framework (CAPMF), a climate policy tracker, climate mitigation action adopted by OECD member countries and partners increased by 1% and 2% in 2022 and 2023 respectively, compared with an average 10% annual increase between 2010 and 2021. While the number, coverage, and stringency of policies do not necessarily reflect policy effectiveness, the slowdown in the adoption of climate action may widen the implementation gap.
We would like to introduce some data published on the site comparing Japan with other OECD countries in relation to renewable energy.
Electric generation by source (Trend view, OECD and JAPAN)
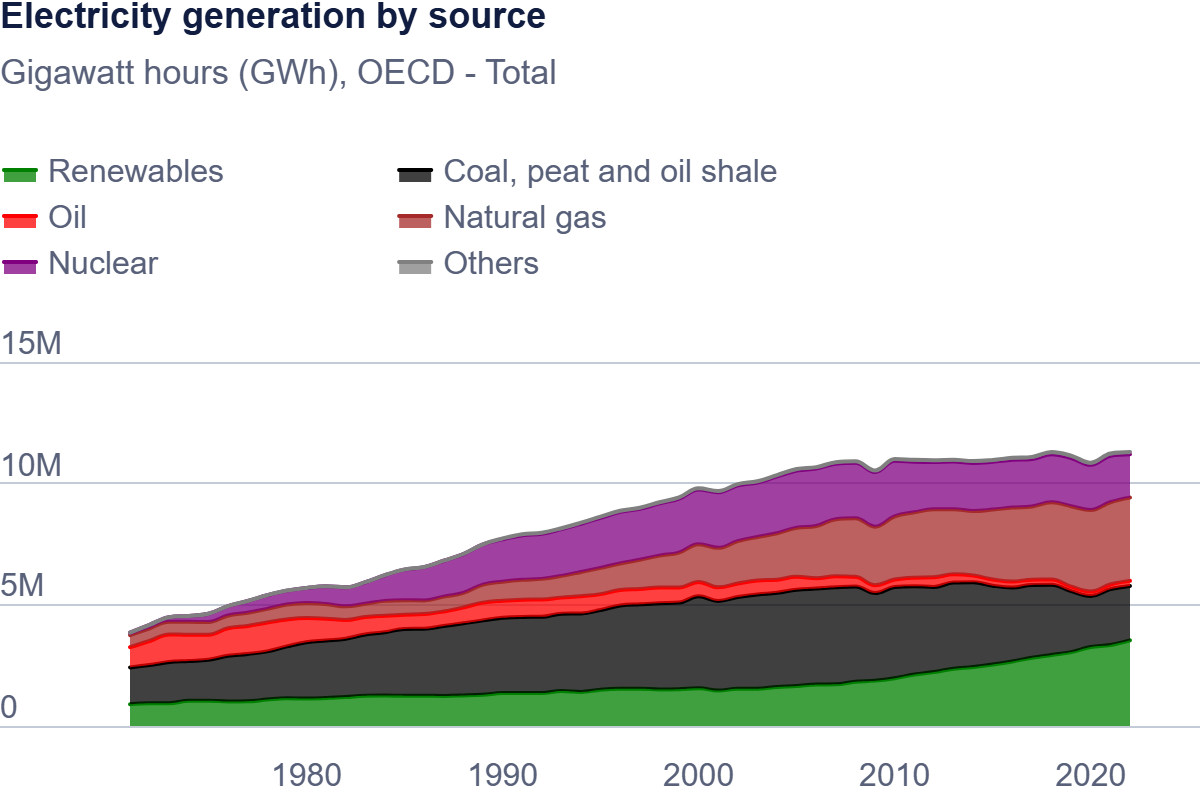
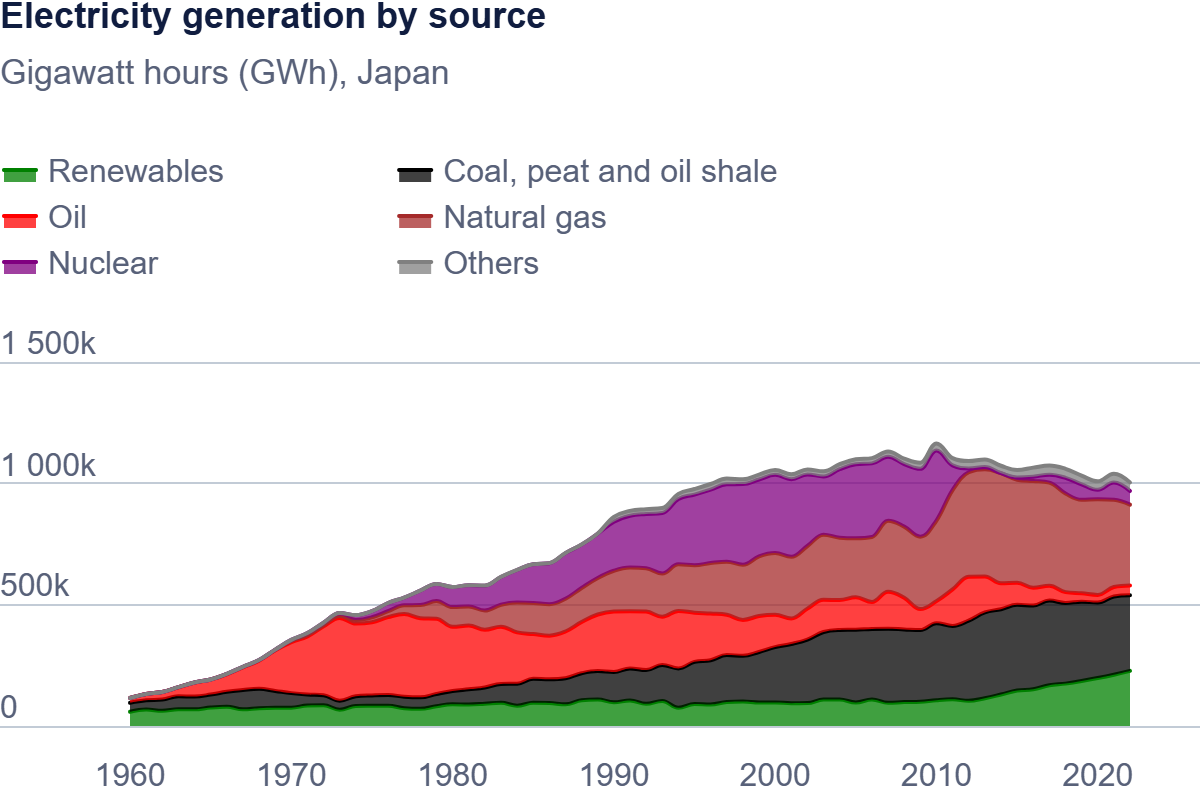
While OECD member countries are steadily shifting from fossil fuel power generation to renewable energy, Japan remains highly dependent on fossil fuel power generation.
Electric generation by source (Comparison view)
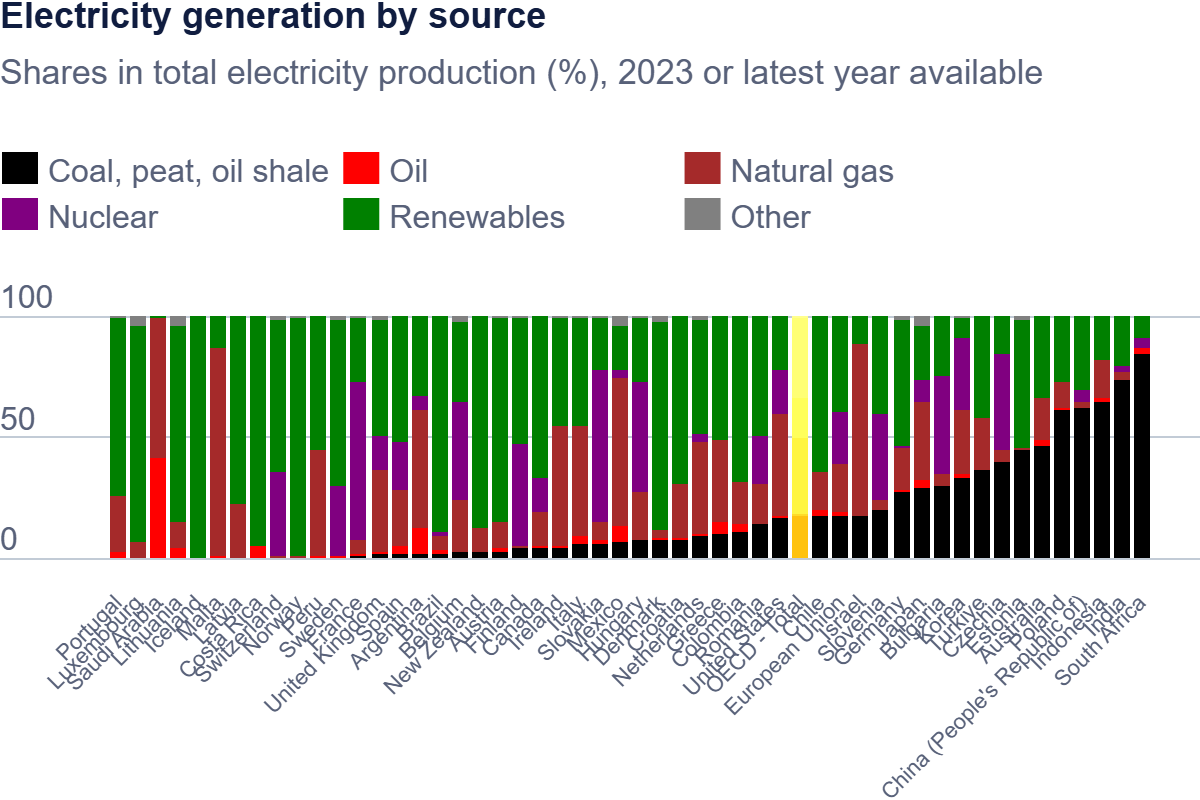
Looking at the breakdown of energy sources in various countries around the world, we can see that Japan is highly dependent on thermal power generation. Countries with a high proportion of nuclear power generation, such as France, Slovakia, Hungary, Finland, and Switzerland, have a higher proportion of renewable energy than Japan, and are successfully combining nuclear power generation with renewable energy.
RD&D budget allocation to renewable energy and low-carbon technologies (Japan, U.S. and Germany)
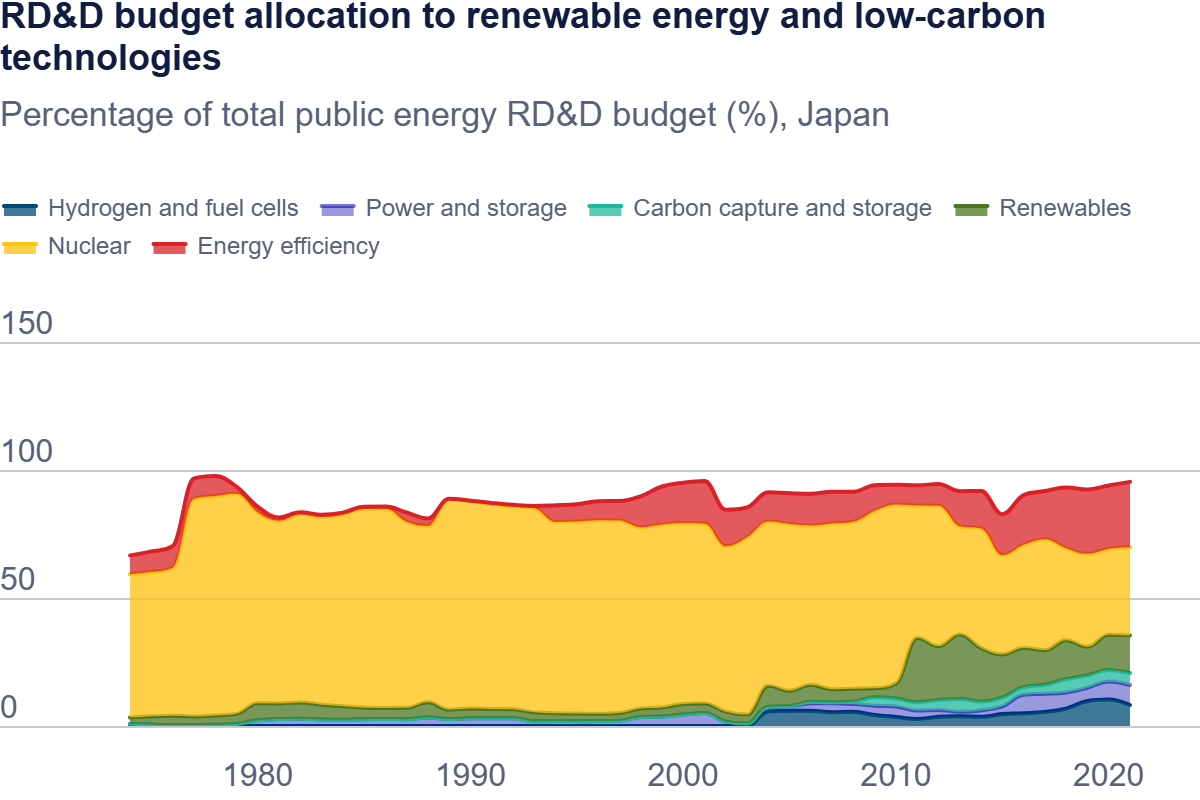
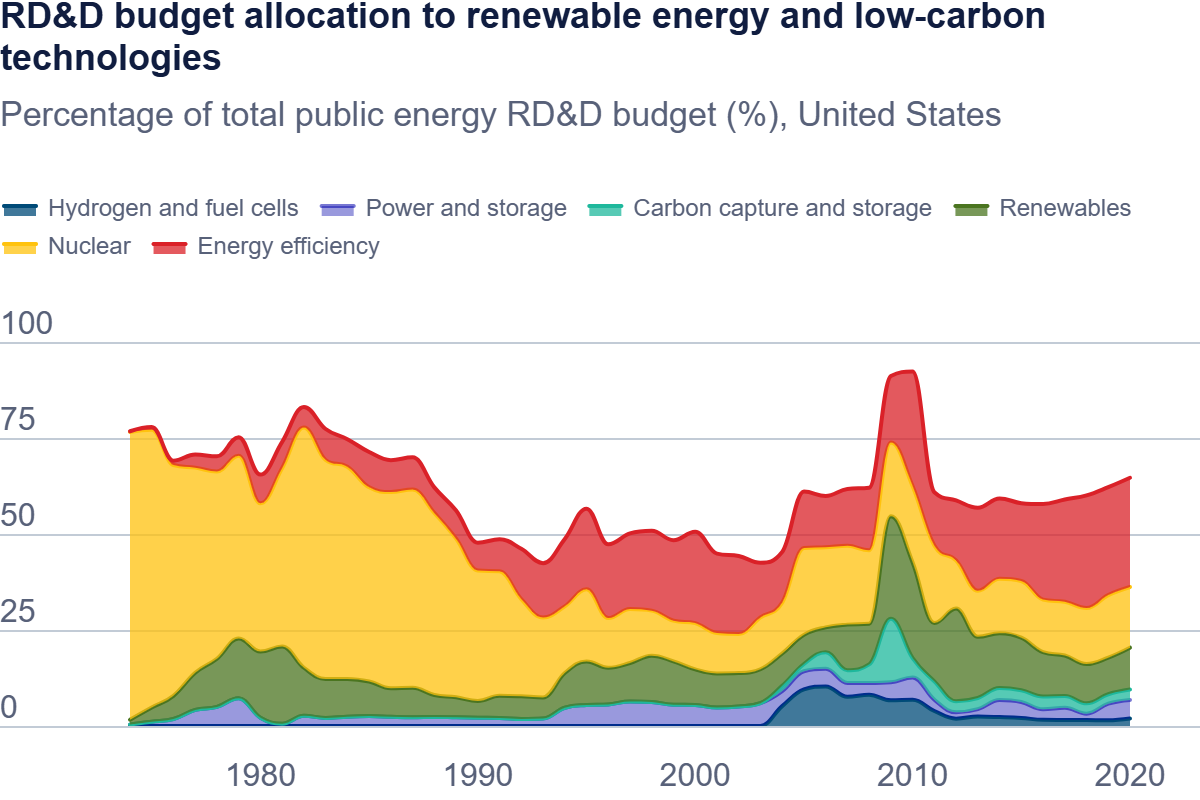
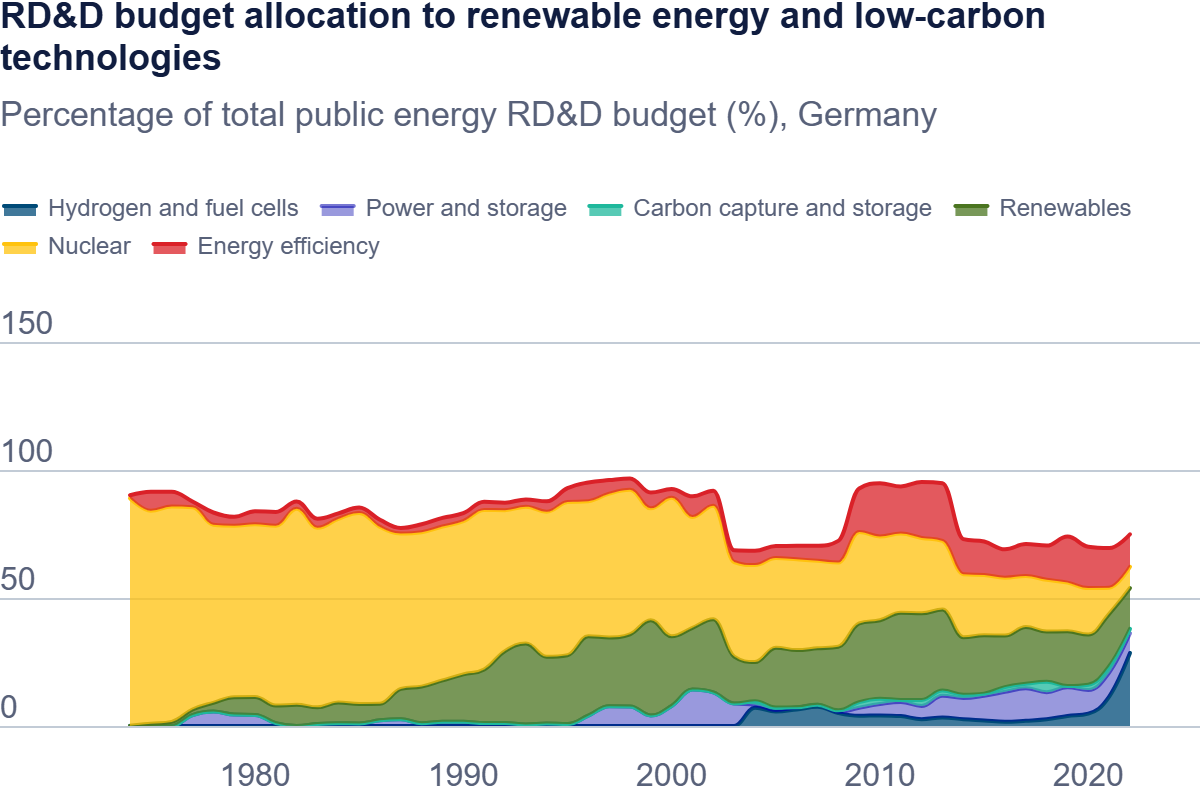
According to OECD data, energy investments in Japan, as well as the United States and Germany, were almost entirely focused on nuclear power from the 1970s to 1990 and were generous for many years. The United States shifted its nuclear investments to other areas after 1990, and Germany did the same after 2000. Japan remains highly dependent on nuclear power, but the data shows that investments have shifted to renewable energy and other energy-related technologies since 2010.
| Energy efficiency | Nuclear | Renewable energy | |
|---|---|---|---|
| Japan | 25.6% | 34.4% | 14.7% |
| U.S. | 28.1% | 16.3% | 10.9% |
| Germany | 12.7% | 8.3% | 15.9% |
**********
The OECD’s “Climate Action Dashboard” is available in English and French. The statistical data is structured as follows. (Note that all links are in English.)
- Overview
- 1. Progress on climate action
- 2. Key Global Indicators
- Net-Zero
- GHG Emissions and targets
- Annual Temperature Change
- Climate mitigation policies
- Emissions
- 3. GHG emission trends and trajectories
- Greenhouse gas emissions
- Greenhouse gas emissions and 2030 target of Nationally Determined Contributions (NDC)
- Greenhouse gas emissions and EU Effort Sharing Regulation target
- Annual difference between GHG emissions and NDC 2030 target
- Annual difference between ESR sector emissions and ESR target
- 4. GHG Emissions intensities trends
- GHG emission intensity per GDP
- GHG emissions per capita
- 5. GHG emissions by source
- GHG emission intensity per GDP
- GHG emissions per capita
- 6. Production- and demand-based GHG emissions
- Production- and demand-based GHG emissions
- Production- and demand-based GHG intensity, energy-related GHG per capita
- Production- and demand-based GHG productivity, GDP per unit of energy-related GHG emissions
- 3. GHG emission trends and trajectories
- Drivers
- 7. Energy use: production, supply and consumption
- Total energy supply by source
- Energy intensity per capita
- Energy productivity
- Electricity
- 8. Material use
- Material consumption trends
- Material consumption per capita
- Material consumption per GDP
- 9. Land use and cover
- Land cover change (no data available)
Please visit the following link: Land Cover Change and Conversions published on 24 May 2018. Download PDF
- Land cover change (no data available)
- 10. Transport & mobility
- Passenger car stock per 1000 inhabitants
- EV passenger cars sales and share of total passenger cars sales
- 11. General economic drivers
- Decoupling of CO2 emissions and growth
- 7. Energy use: production, supply and consumption
- Impact & risks
- 12. Impacts on climate and environmental conditions
- Annual temperature change
- Annual precipitation change
- 13. Climate-related hazards and vulnerabilities
- Population exposure to hot days
- Population exposure to icing days
- Cropland exposure to extreme precipitation events
- Cropland exposure to drought
- Forest exposure to wildfire danger
- Built-up area exposure to violent windstorms
- Population exposure to river flooding
- Population exposure to coastal flooding
- 12. Impacts on climate and environmental conditions
- Actions & opportunities
- 14. Climate policies
- Policy adoption by instrument type
- Policy adoption by area
- 15. Market-based Instruments
- Policy adoption by instrument type (Market-based instruments)
- Policy in place (Market-based instruments)
- Net Effective Carbon Rate (ECR) by sector
- Environmentally related tax revenue as percentage of total tax revenue (%)
- RD&D budget allocation to renewable energy and low-carbon technologies
- 16. Non-Market Based Instruments
- Policy adoption by instrument type (Non-market-based instruments)
- Policies in place (Non-market-based instruments)
- MEPS for electric motors
- Development of environment-related technologies
- Protected terrestrial area
- 17. Targets, international co-operation, governance, and climate data
- Policy adoption by instrument type (Targets, governance, climate data and international co-operation)
- Policies in place (Targets, governance, climate data and international co-operation)
- Aid to climate change adaptation and mitigation by donor country
- International initiatives joined
- Annual funding for climate advisory body
- 14. Climate policies
**********
Acknowledgments: We would like to take this opportunity to thank the source OECD for these statics and data.