PV column
Photovoltaic
2024/07/11
“Global Market Outlook For Solar Power 2024-2028” by SolarPower Europe
To learn more about the global solar market and its trends over the next five years, SolarPower Europe has published this year’s edition of “Global Market Outlook for Solar Power 2024-2028.” The market trend of solar power generation is very clearly summarized.
Source: https://www.solarpowereurope.org/insights/outlooks/global-market-outlook-for-solar-power-2024-2028
This column provides an introduction and executive summary of this report.
***********
00 Foreword
Introduction
Welcome to the Global Market Outlook for Solar Power 2024-2028.
For an established sector like solar, approaching double growth in one year was simply not part of any analyst’s script. But it happened in 2023. The world deployed 447 GW of new solar PV capacity last year; an incredible 87% more than 2022 and achieving a growth rate we haven’t seen since 2010, when the global solar market was only 4% of today’s size.
In last year’s Global Market Outlook, we actually did anticipate growth for several reasons, but not as high as what was achieved. At that time, a very strong growth in global manufacturing capacities was already visible, making products available again after the pressures of the pandemic and energy crisis. This, of course, also brought overcapacity – effectively doubling supply against demand. Resulting price drops triggered by hefty competition from all these new capacities was expected as well (though not at the severity the industry eventually experienced). In fact, our growth forecast for all global markets combined, other than China, was nearly spot on – we deviated only by 3% absolute.
The accuracy and value of the annual Global Market Outlook for Solar Power would not be possible without the industry stakeholders and all national and regional solar industry associations that provide their input and expertise each year. We would like to extend our gratitude to those experts and their organisations in supporting our mapping and modelling work, and particularly those from the 31 annual GW-scale solar markets that wrote in-depth features of their home markets for this year’s edition (see p. 81).
However, the market that is continually difficult to anticipate remains to be China, the world’s largest solar market by far, which boomed by 167% in a single year. This country alone was responsible for 57% of global installed capacity in 2023, adding a quarter of a TW, basically the same amount that the entire world had deployed in the previous year. The massive price collapses of around 50% for modules in 2023 alone triggered unforeseen growth, driven by price elasticity on the demand side. To better understand solar developments in China, this year’s report covers the country in a dedicated chapter, provided by the Global Solar Council and its partner the Chinese Renewable Energy Industries Association (CREIA) (see p. 61).
So, what’s in store for solar this year and beyond? For the supply side, the PV manufacturing industry will continue to suffer from record-low prices and overcapacities – how long will depend on the consolidation speed in the sector. The demand side will further benefit from low product prices that will stay a main driver in a difficult macro-economic environment. We will see the climate emergency continuing to capture governments’ attention and energy security remaining the new compelling argument to invest in solar power in a quickly fragmenting world order. Further driven by cost improvements and the numerous benefits the technology provides, we have increased our most likely outlook to 544 GW in 2024, based on a 22% YoY growth, and low two-digit improvements to an annual market of 876 GW in 2028.
We have been hearing doubts from many analysts if solar can grow much beyond today’s annual installation levels. While obviously there will be an eventual limit, we don’t foresee this any time soon. Who would have thought that only a year ago that China would install over 250 GW last year? Nobody! We should also remember, solar’s share in global electricity generation was only at 5.5% in 2023, China’s installed watt per capita was 460 W/c, and MEA on average only 27 W/c, compared to 1,359 W/c in Australia – there’s clearly quite some room to grow. For the first time in our five-year forecasting period, our High Scenario is touching an annual TW deployment rate in 2028.
While the PV industry is ready for more, it now hinges on policymakers creating the right legal frameworks to enable solar in unfolding its full potential. That’s why, for the first time, this edition contains policy recommendations from solar’s global industry organisation, the Global Solar Council (see p. 57). This includes asks for setting ambitious national targets, and immediate efforts to unleash the flexibility revolution by scaling up investments in battery storage, grids, and electrification. We also urgently need diversification – on both the supply and demand side, and plenty of financing.
To the sector’s gratification, the recent IEA World Energy Investment 2024 report revealed that investment in solar surpassed all other generation technologies combined. However, there remains severe disparity in global renewable investment flows. Two thirds of the world’s population, living in emerging and developing economies outside China, only received 15% of global investment. Last year’s COP saw world leaders committing to triple world renewables by 2030 to achieve 11 TW, and this year’s COP29 must accordingly set the finance plan for the transition for the countries most in need. The climate crisis, and breaching 1.5⁰C warming, is barrelling toward us like a freight train. We hope this year’s Global Market Outlook supports the solar sector in building a new track toward more sustainable and secure prosperity for all.
***********
01 Executive summary
Introduction
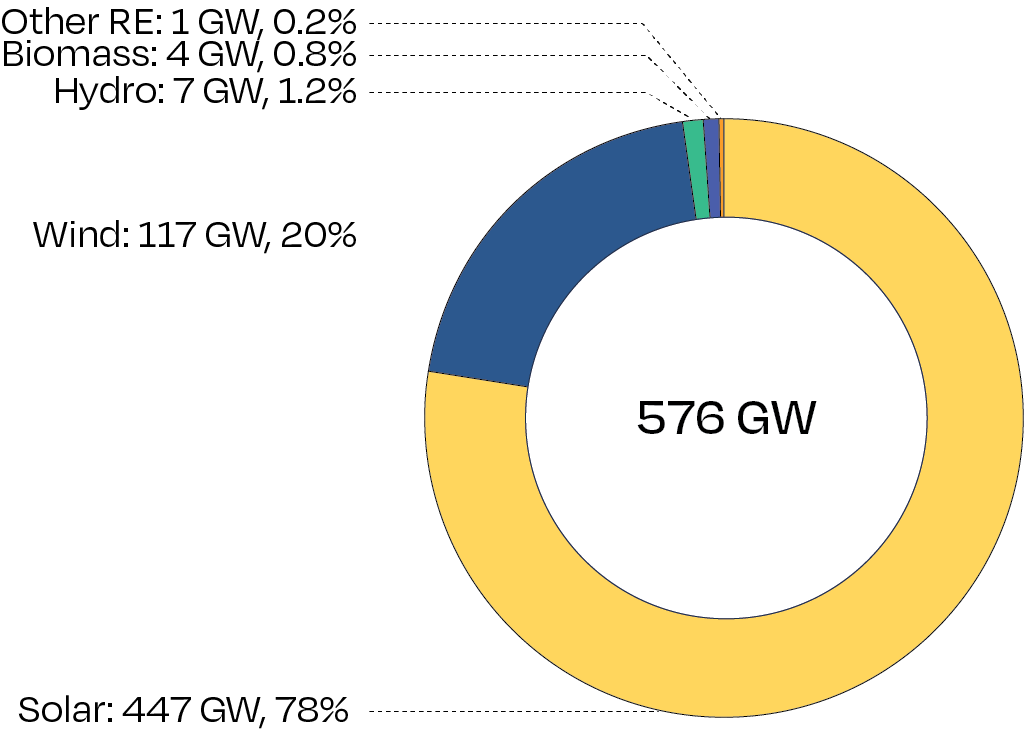
In 2023, the world grid-connected 447 GW of new solar capacity, which, once again, dominated the newly added global power generation capacity. Solar PV accounted for 78% out of 576 GW of new renewable capacity added last year. Solar’s share of new renewable capacity increased considerably, up 12 percentage points from the 66% contributed in 2022 and 22 percentage point more than the 56% in 2021. This new record confirms solar’s role as an established and still rising leader of the global energy transition, installing over three times more capacity than all other renewable technologies combined.
FIGURE 1 NET RENEWABLE POWER GENERATION CAPACITY INSTALLE IN 2023
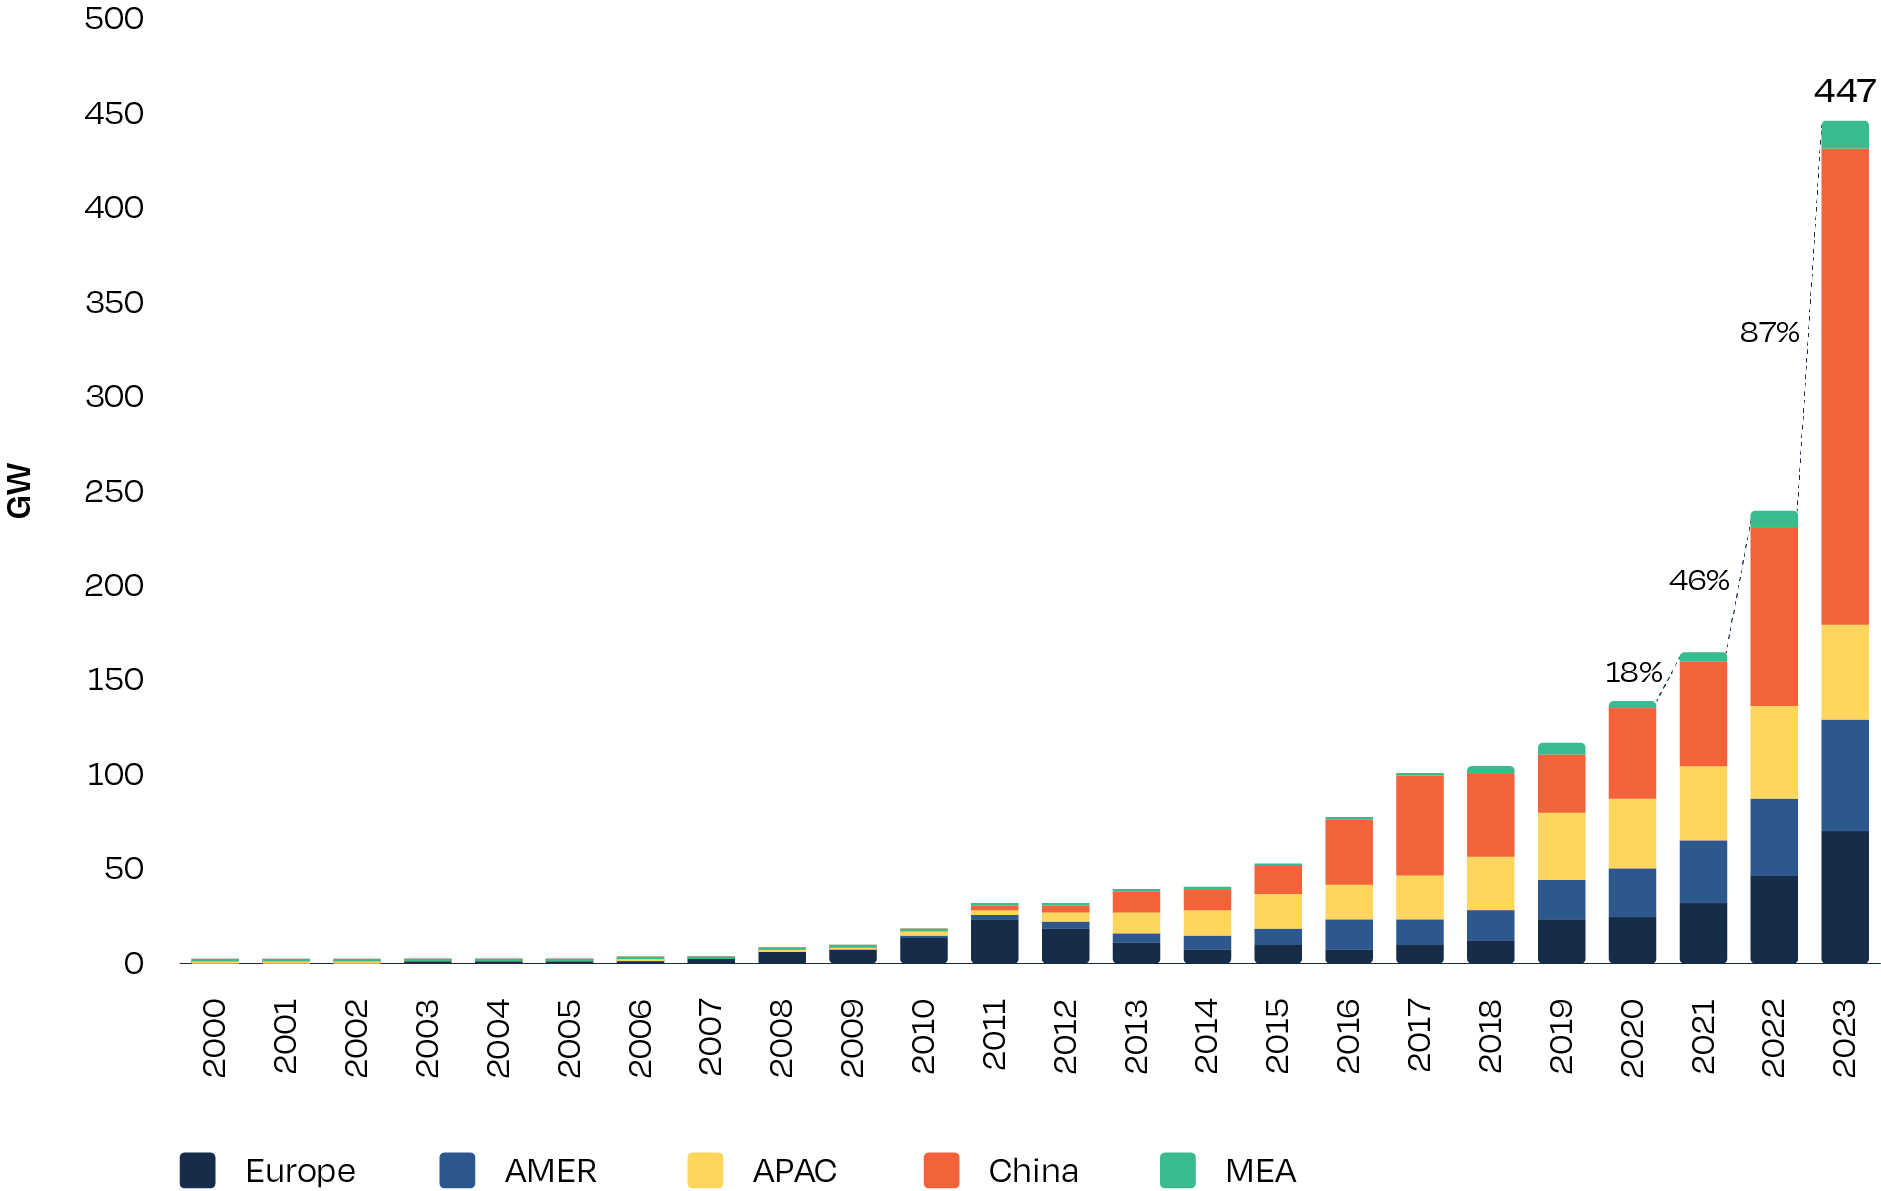
The 447 GW of new solar capacity broke any previous record and far exceeded any solar analyst’s expectations, marking an extraordinary 87% growth rate (see Fig. 2). This compares to 2022’s addition of 239 GW and 46% year-on-year growth.
FIGURE 2 ANNUAL SOLAR PV INSTALLED CAPACITY 2000-2023
The surge in installed solar capacity can be attributed to several key factors. Firstly, a significant increase in global PV manufacturing capacities greatly improved the availability of solar modules following the supply chain issues experienced during the pandemic. This capacity expansion resulted in overcapacities and severe price drops for system components over the course of 2023, with modules’ values falling by around 50%.
In addition, the effects of the 2022 global energy crisis continued to stimulate demand across various regions. Governments, individuals, and businesses turned to solar power as a reliable and cost-effective solution to high energy prices, while accelerated electrification of the heat and transport sectors also gained much more attention. Many orders from 2021 and 2022 were finally installed in 2023, thanks to the increased availability of products and installers at more affordable prices.
While the scale of 2023’s growth was unprecedented, it needs to be highlighted that most of this global market expansion was driven by and in China. The world’s largest solar product supplier and market for years, China broke any previous record by adding an incredible 253 GW of new solar PV capacity in 2023, marking a 167% year-on-year growth rate. Meanwhile, the rest of the world installed ‘only’ 194 GW of new solar PV, reflecting a 35% increase from the 144 GW deployed in 2022 (Fig. 3). In other words, without China’s strong solar investments in deployment, the solar sector’s growth would have been much more modest.
FIGURE 3 TOP 10 SOLAR PV MARKETS, 2022-2023
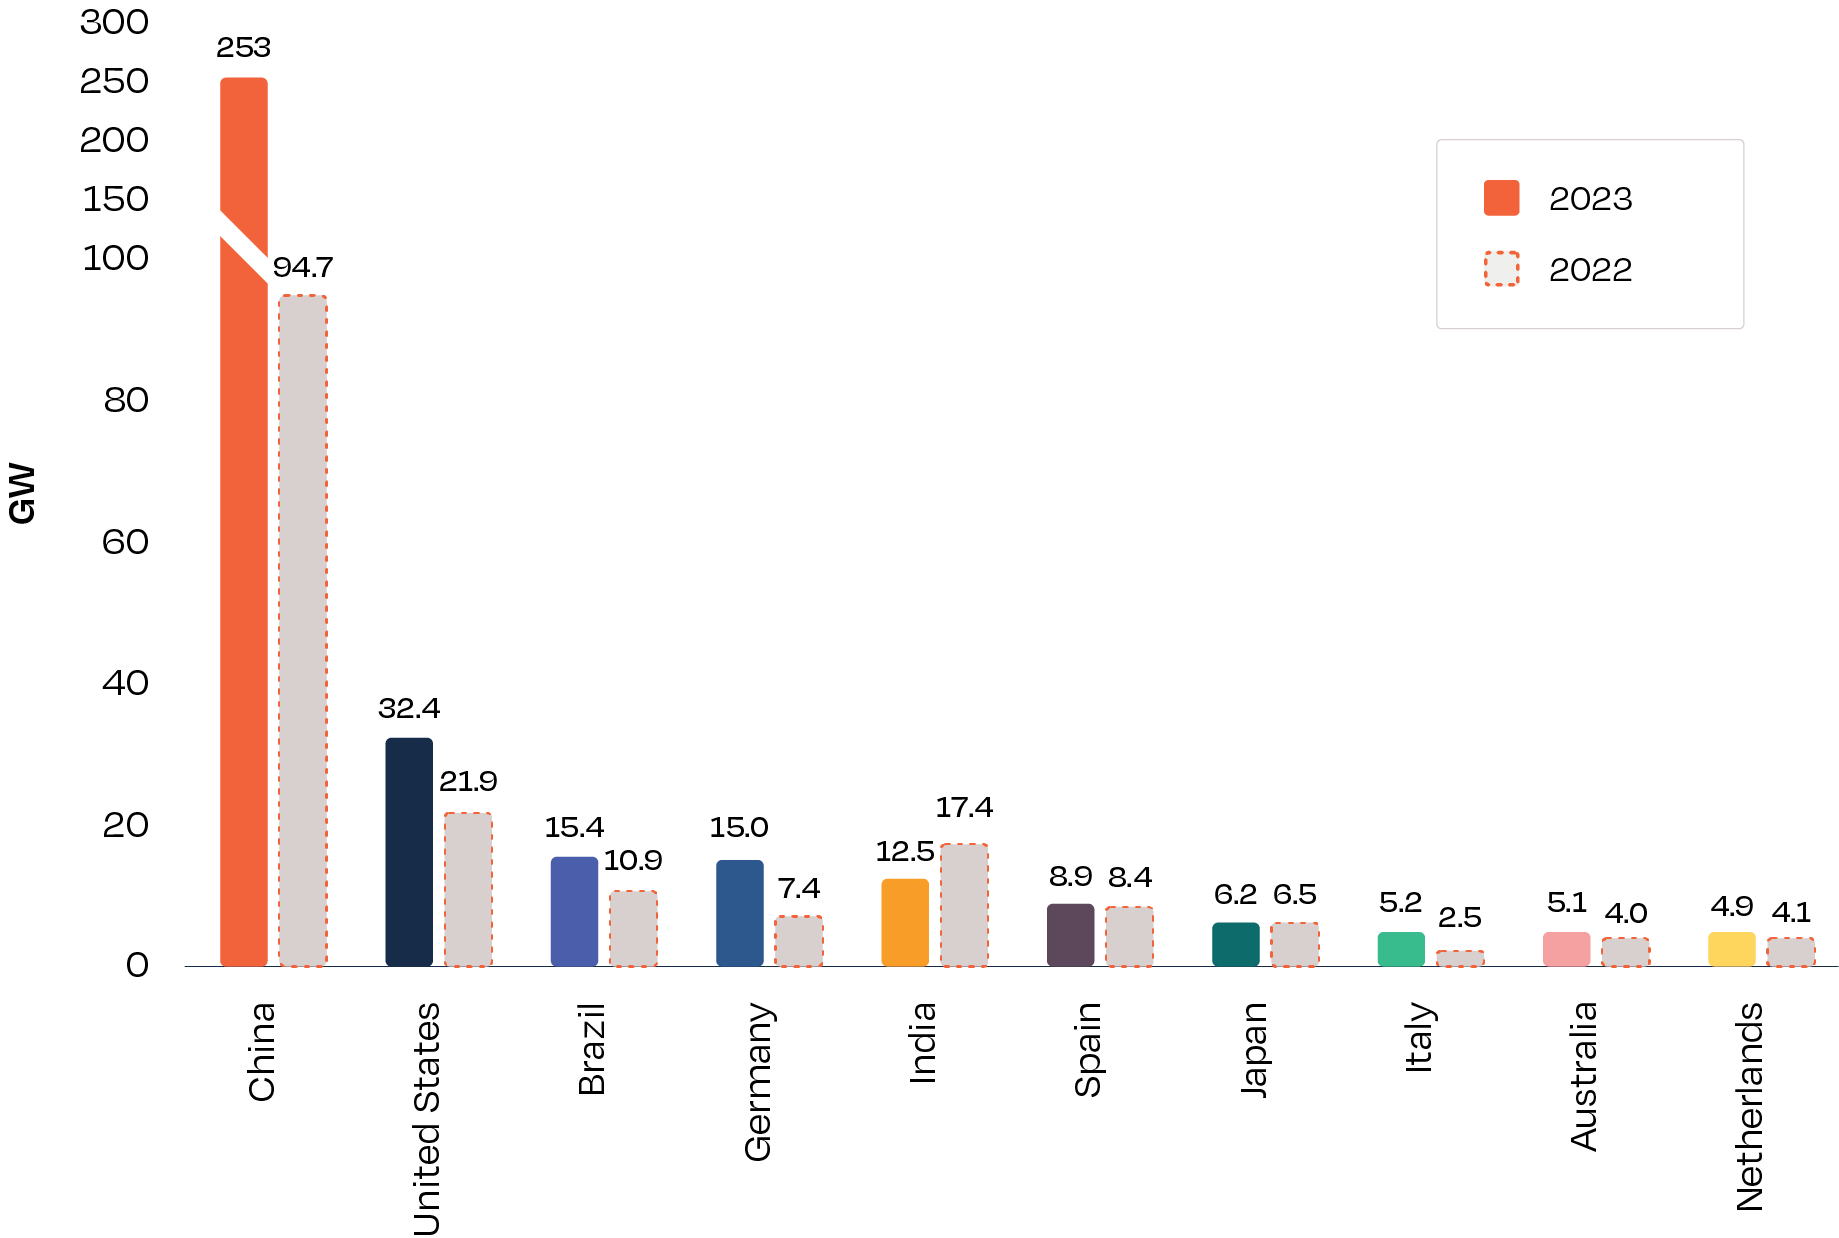
Eight of the top 10 largest solar markets experienced growth in 2023, with only India and Japan experiencing a downturn in their market. The United States got back on track after a turbulent solar business year in 2022 and recorded a 48% growth rate in 2023, with 32.4 GW of solar PV grid-connected. Germany installed 15 GW in 2023, marking a new record for any European country. The previous record was held by Italy with 9.3 GW installed long back in 2011, during the first boom phase of the European solar story. Comprised together, the top 10 markets represented 80% of the global solar PV market in 2023.
We anticipate substantial demand growth for solar PV power in the coming years, driven by further cost improvements, product availability, and the numerous benefits the technology provides. Climate emergency will continue to capture governments’ attention, while energy security will remain a compelling argument to invest in solar power in a quickly defragmenting world order.
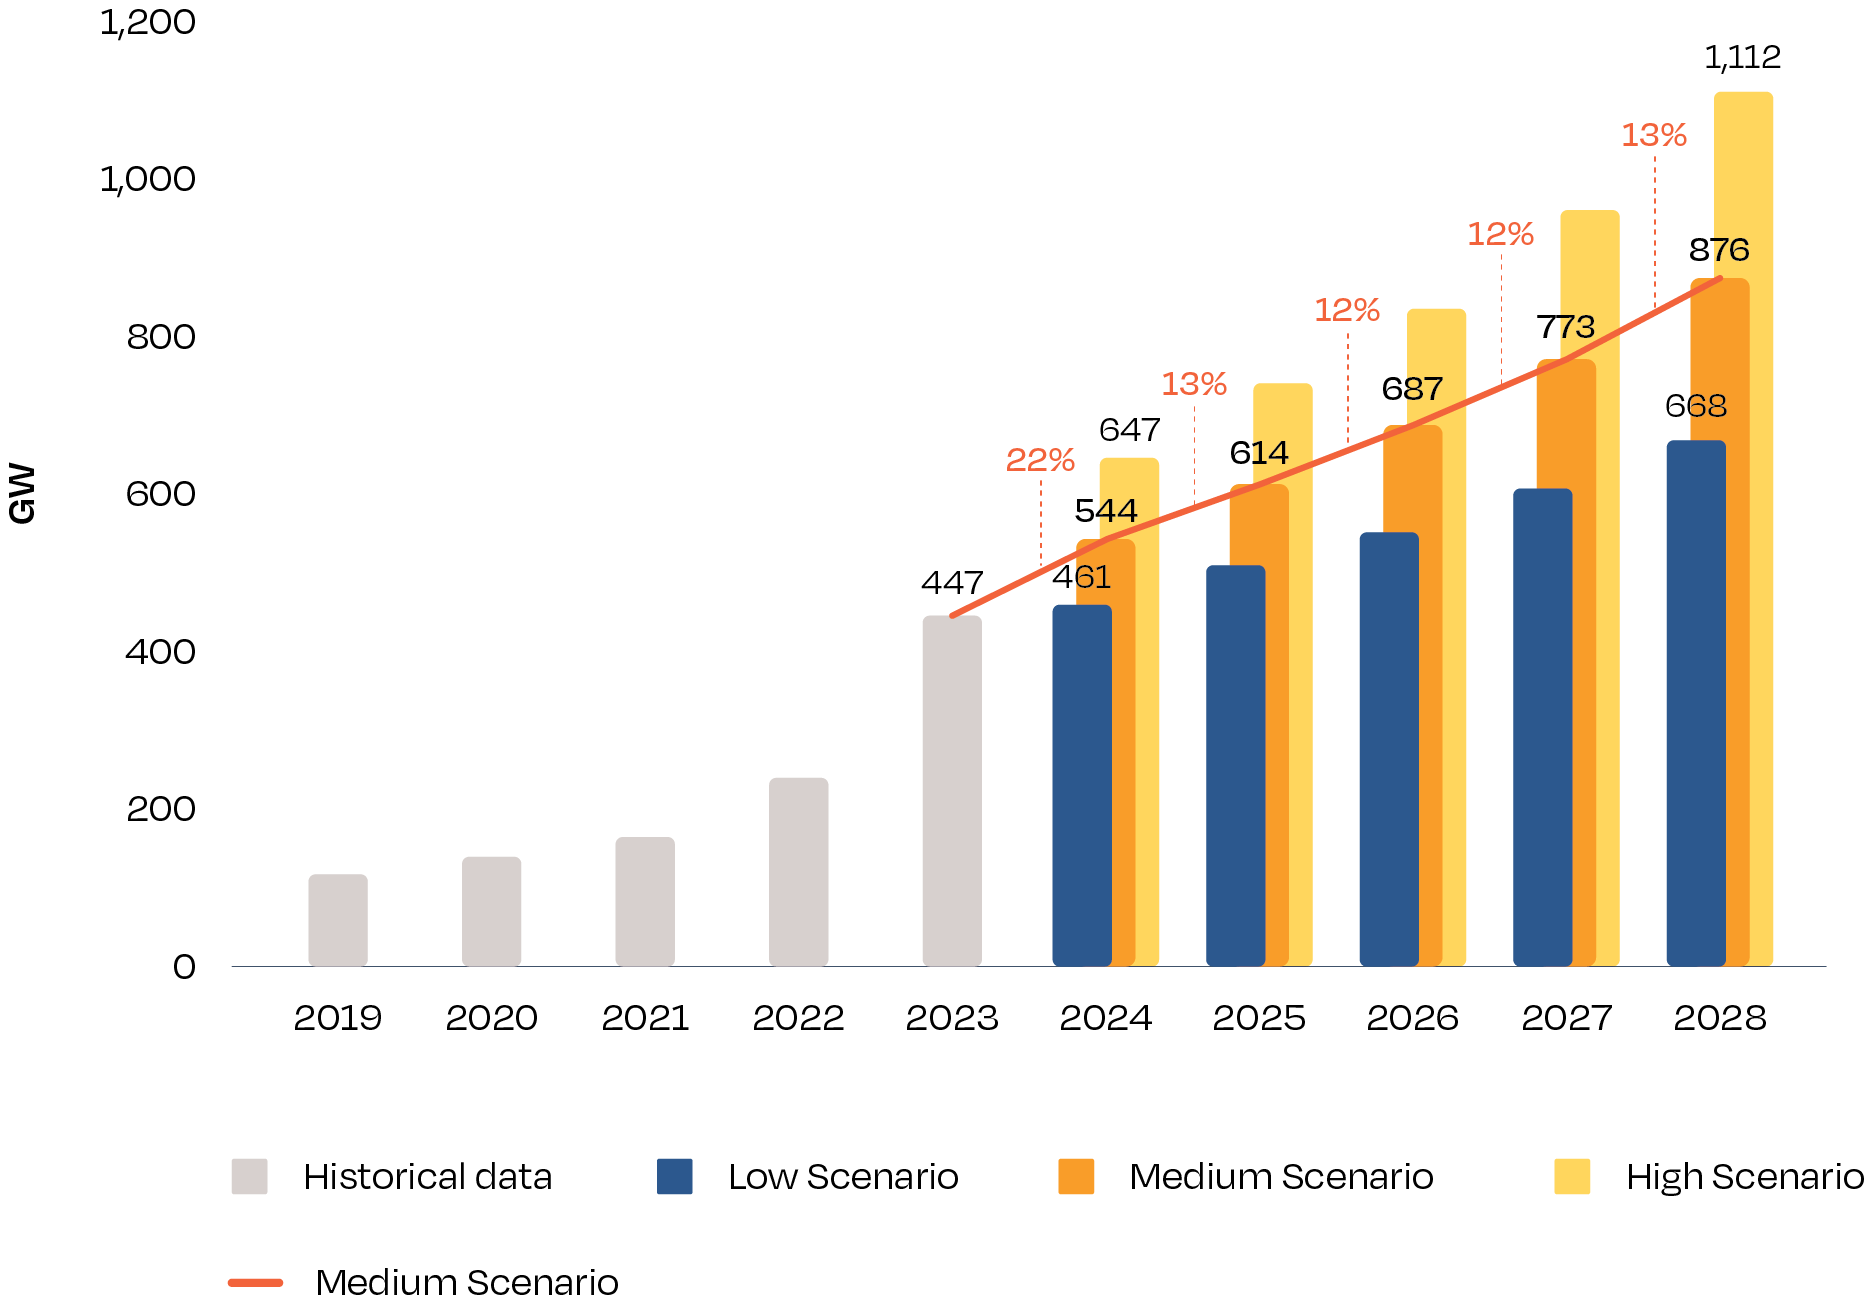
For 2024, our Medium Scenario forecasts a global growth rate of 22% to a market size of 544 GW, approximately 100 GW more than in 2023 (see Fig. 4). As we’ve seen in recent years, current global market forecasting will depend largely on getting China’s solar deployment right due to its outstanding position in the global PV landscape. With analysts severely underestimating China’s market expansion in the past, and several reasons speaking for further growth, we estimate deployments of 299 GW, a year-on-year uptick of 18%. Modelling variations depending on policy and economic developments, our more optimistic High Scenario projects 45% annual growth to 647 GW, while our Low Scenario anticipates only 3% growth to 461 GW in 2024. In the mid-run, annual global market installations reach 614 GW in 2025 under the Medium Scenario, a 13% increase from 544 GW in 2024, followed by a 12% increase to 687 GW in 2026, 12% to 773 GW in 2027, and 13% to 876 GW in 2028.
FIGURE 4 WORLD ANNUAL SOLAR PV MARKETS SCENARIOS 2024-2028
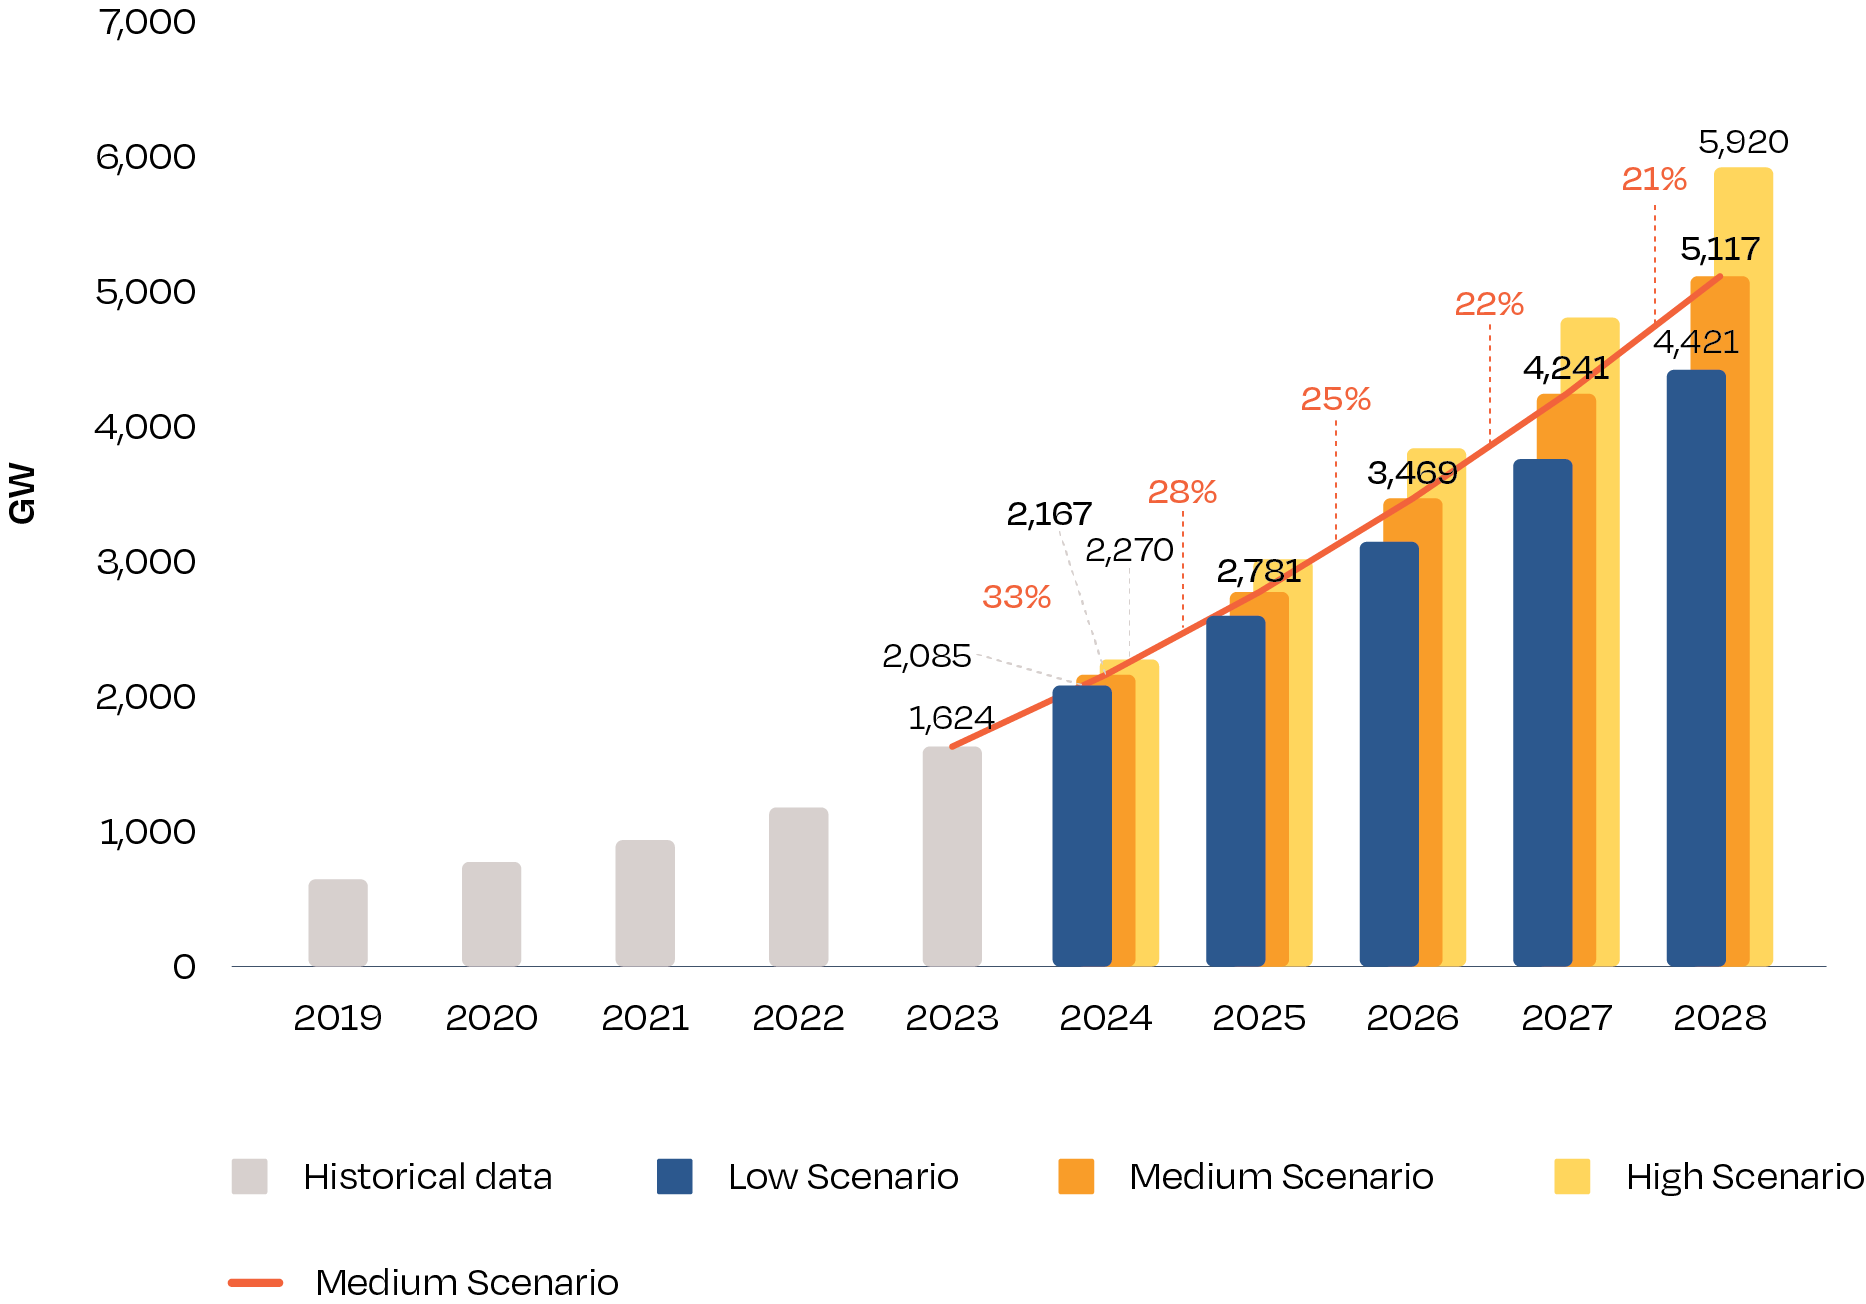
After surpassing the 1.6 TW level in 2023, the global solar power fleet is on track to exceed 2 TW by 2024 (see Fig. 5). Our Medium Scenario estimates 2.2 TW in 2024, 2.8 TW in 2025, 3.5 TW in 2026, 4.2 TW in 2027, and 5.1 TW in 2028 – a forecast that is significantly higher than last year’s Medium Scenario.
FIGURE 5 WORLD CUMULATIVE SOLAR PV MARKETS SCENARIOS 2024-2028
Looking beyond our traditional 5-year forecast horizon – to 2030 as significant milestone year on the path to global net zero – a simple extrapolation of our Medium Scenario 2024-2028 projects 7.4 TW of solar operating capacity worldwide, which is above any of the most recent 2030 estimates of leading solar analysts.
The strong PV expansion in 2023 brough a new record number of sizeable solar markets. The number of GW-scale solar markets – countries installing at least 1 GW – increased from 28 in 2022 to 31 in 2023, 14 of which are located in the European Union. We estimate this group to further augment to 37 GW-scale markets in 2024 and 50 in 2025.
With China’s dominant solar role further increasing to unknown heights, we have picked the country as this year’s focus theme. The chapter was contributed by the Global Solar Council (GSC), which also provided another new addition – Policy Recommendations addressing the key challenges for the global solar sector.
**********
This is the end of the introduction to this executive summary report, so please take a look at the more detailed data and analysis in the main body of the report.
Link: https://www.solarpowereurope.org/insights/outlooks/global-market-outlook-for-solar-power-2024-2028