太陽光発電コラムPV column
コンサルティング
2025/02/01
OECDによる気候変動対策ダッシュボード
日本をはじめ世界38カ国が加盟している経済協力開発機構(OECD: The Organisation for Economic Co-operation and Development)では、温室効果ガス削減や温暖化に関する統計データを公表しております。
今回のコラムでは、Climate Action Dashboard (気候変動対策ダッシュボード)の概要と、再生可能エネルギーに関するデータをご紹介します。
なお本コラム文末にはClimate Action Dashboardの目次とリンクを記載しておりますので、ご興味のある方は是非ご覧ください。
出展元: https://www.oecd.org/en/data/dashboards/climate-action-dashboard.html
**********
Climate Action Dashboard (気候変動対策ダッシュボード)
Climate Action Dashboard (気候変動対策ダッシュボード)には、気候目標に向けた進捗状況を追跡し、各国の気候行動のスナップショット(速報)を提供するために使用される主要な指標が掲載されています。ダッシュボードは、環境指標の圧力-状態-対応(PSR)モデル (気候変動対策モニター 2023)に基づく4つの主要な項目を中心に構築されています。ダッシュボードは、温室効果ガス(GHG)排出量の傾向と、国別決定貢献(NDC)で提示された緩和コミットメントの状況を考慮した圧力と推進要因から始まります。排出を促進する活動とセクターの進化について説明します。リスクと脆弱性、特に気候関連のハザードに関する指標を提示することで、気候と環境の状態を監視します。最後に、気候変動の緩和と適応を目的とした政策と行動を監視することで、国家の対応をカバーします。
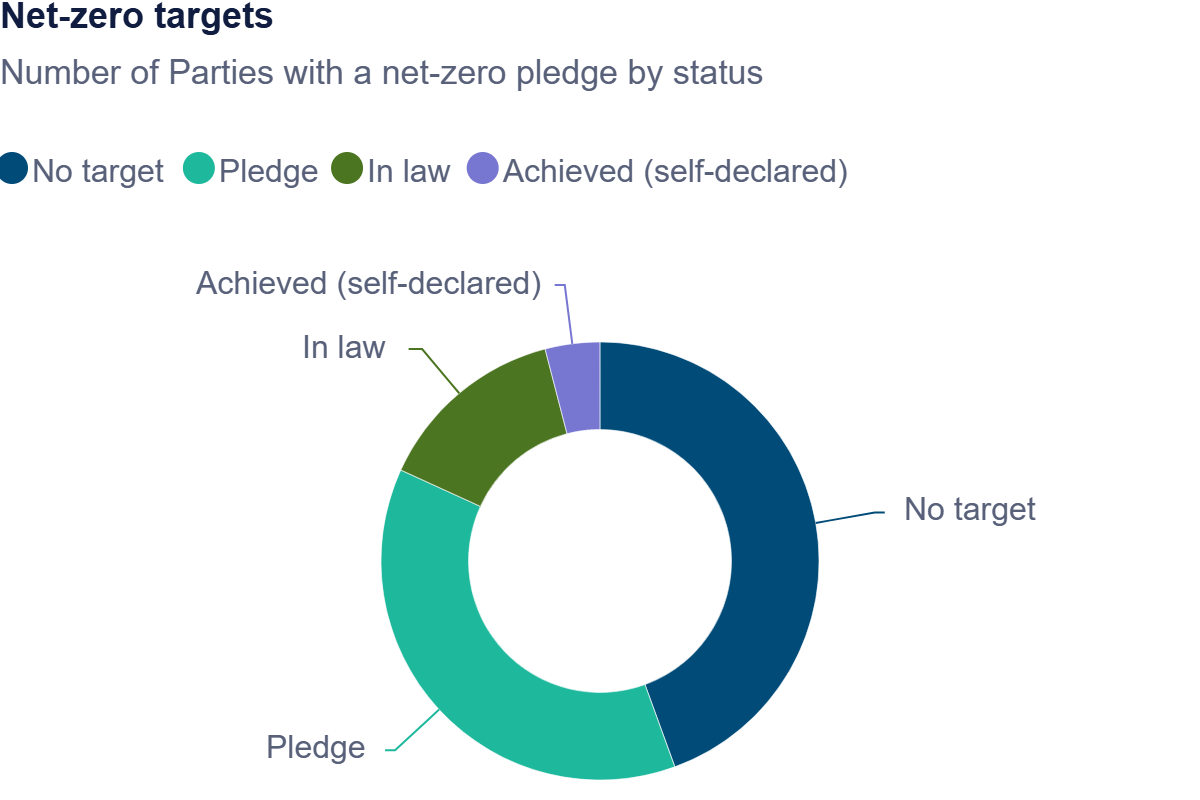
Net-Zero (ネットゼロ)
2024年7月現在、110か国がネットゼロ目標を約束しており、96か国が2050年までにこの目標を達成することを目指しています。ただし、ほとんどの目標は法的拘束力がありません。ネットゼロ目標は世界のGHG排出量の約88%をカバーしていますが、世界の温室効果ガス排出量の16%を占める27か国と欧州連合のみがこれらの目標を法律に定めています。
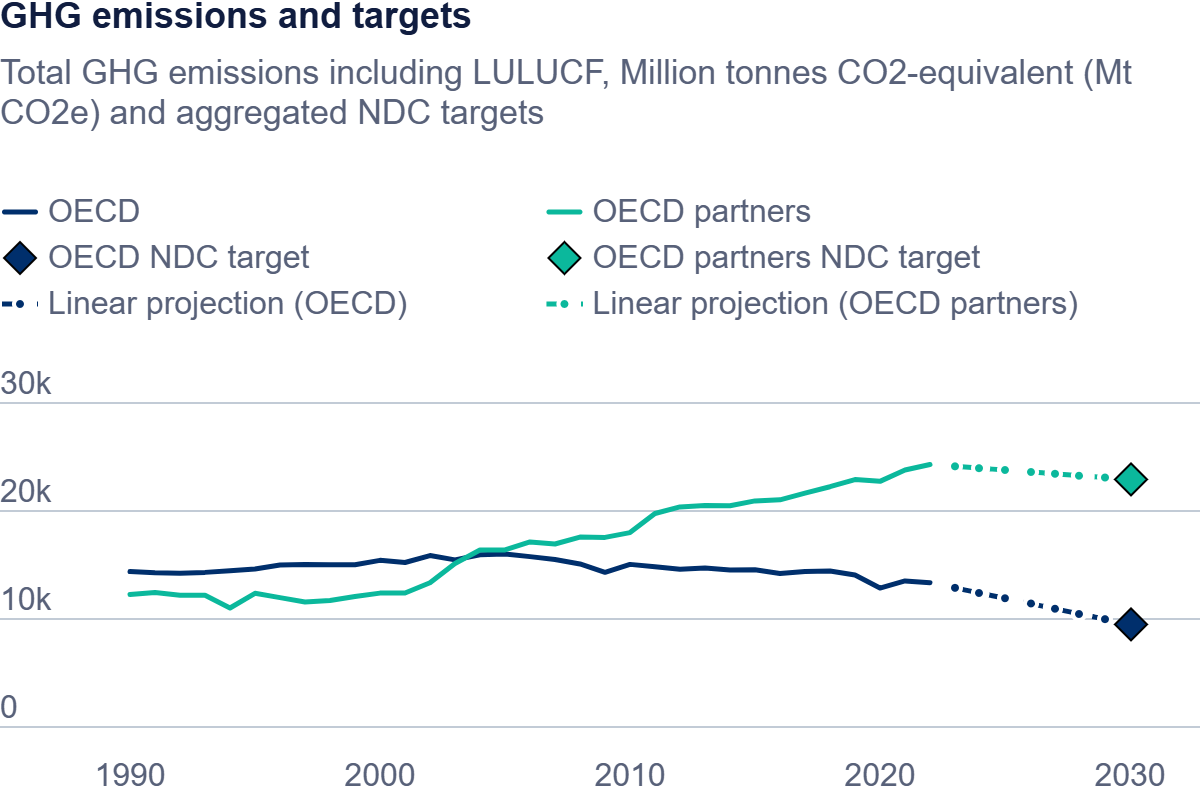
GHG Emissions and targets (温室効果ガス排出量と目標)
IPCCの推定によると、今世紀末までに地球温暖化を1.5℃に抑えるには、2030年までに温室効果ガスの総排出量を2019年比で43%削減する必要があります。これは、各国がそれぞれの気候目標を大幅に強化する必要があることを意味します。現在、OECD加盟国とパートナー諸国は、2022年比でそれぞれ29%と5.7%の排出量削減を約束しています。
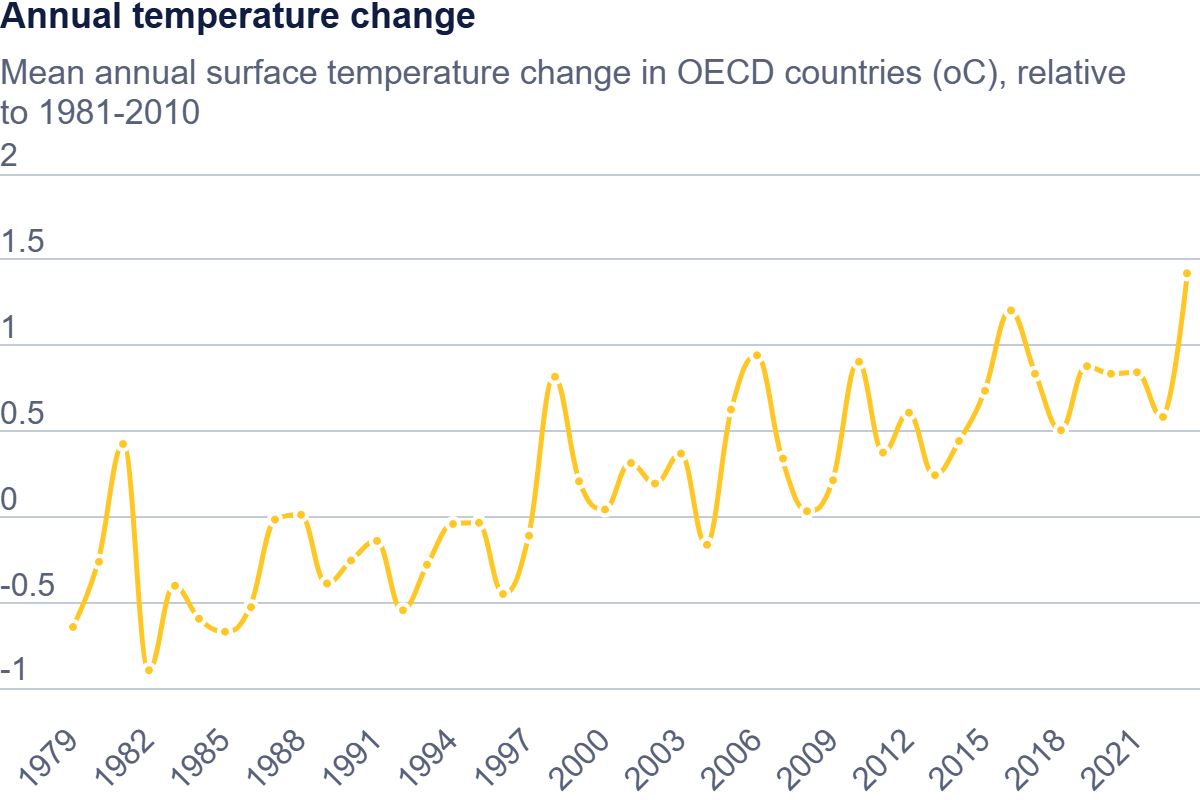
Annual Temperature Change (年間気温の変化)
過去数十年にわたり、地球上の年間地表温度は上昇しています。2023年、世界は記録上最も暑い年を経験し、地表温度は1991~2020年の平均より0.6℃上昇し、最高気温が35℃を超える日を経験する人が5億人以上増えました。さらに、2024年は地球温暖化の新記録を更新する見込みで、2024年8月時点ですでに15の国別気温記録が破られています。
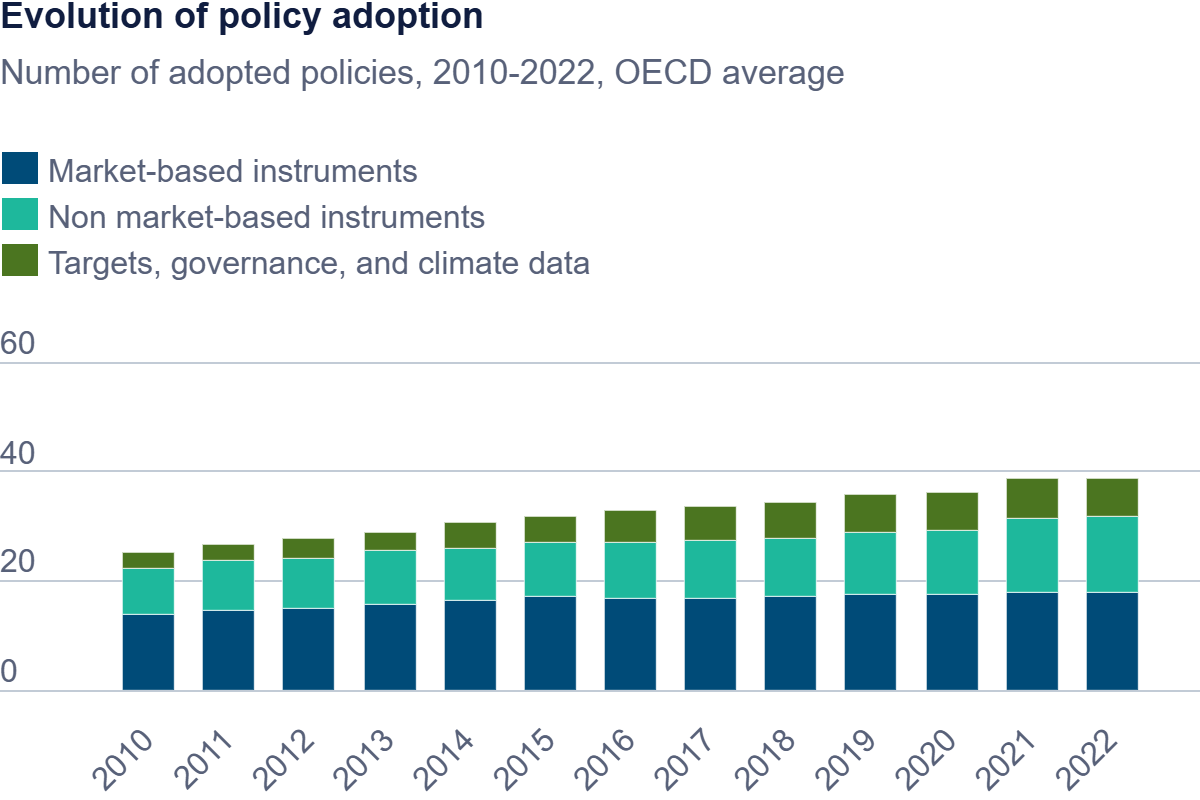
Climate mitigation policies (気候緩和政策)
気候政策追跡システムであるIPAC気候変動対策行動・政策測定フレームワーク (CAPMF)によると、OECD加盟国とパートナーが採用した気候緩和措置は、2010年から 2021年までの平均年間増加率10%に対して、2022年と2023年にそれぞれ1%と2%増加しました。政策の数、対象範囲、厳格さは必ずしも政策の有効性を反映するものではありません。しかし、気候行動の採用が鈍化すると、実施ギャップが拡大する可能性があります。
同サイトで発表されている再生可能エネルギーに関連するOECDと日本の比較に関連するデータをご紹介します。
Electric generation by source (Trend view, OECD and JAPAN)


OECD加盟諸国では順調に火力発電から再生可能エネルギーへシフトしてきていますが、日本では火力発電への依存度が高い状況が続いております。
Electric generation by source (Comparison view)
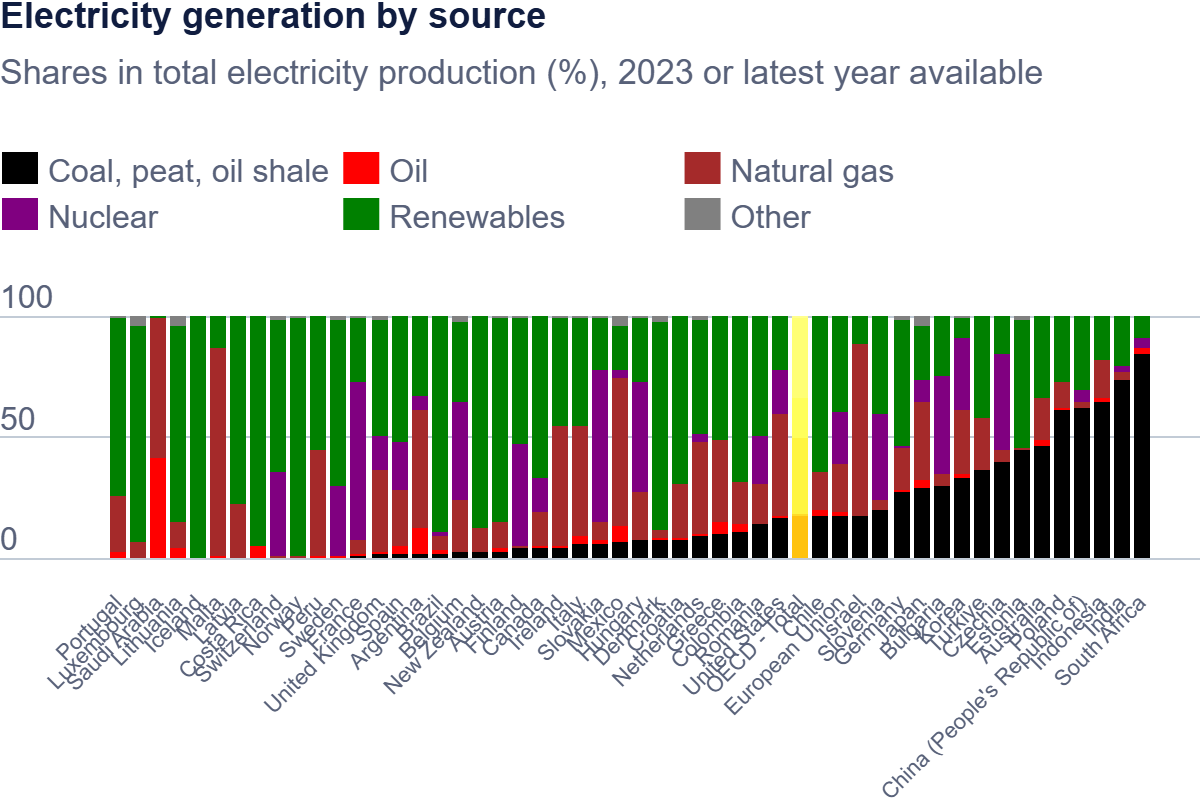
世界各国の発電源毎の割合をみても、日本は火力発電への依存度が高い事が読み取れます。原子力発電の割合が多いフランス、スロバキア、ハンガリー、フィンランド、スイスでは、再生可能エネルギー割合がいずれも日本より多く、原子力発電と再生可能エネルギーを上手く組合せている事が推察されます。
再生可能エネルギーと低炭素技術への研究開発予算配分(日本、米国、ドイツ)
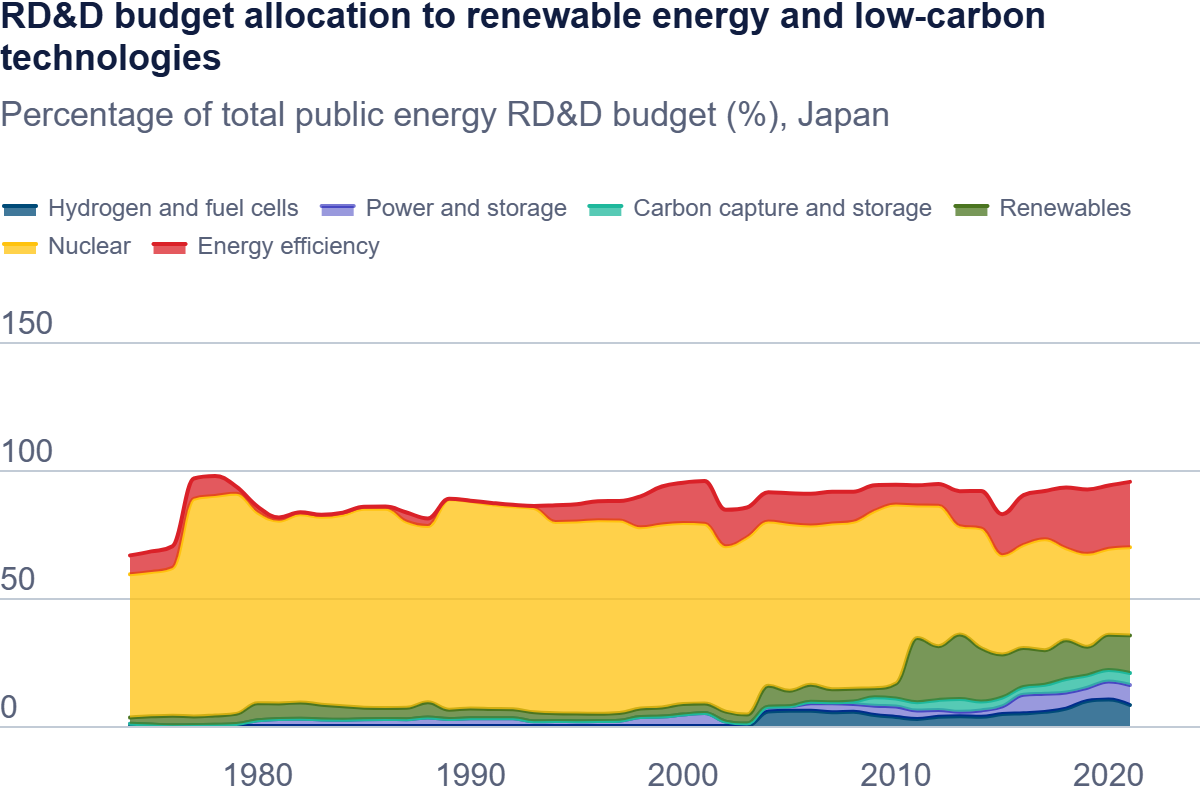
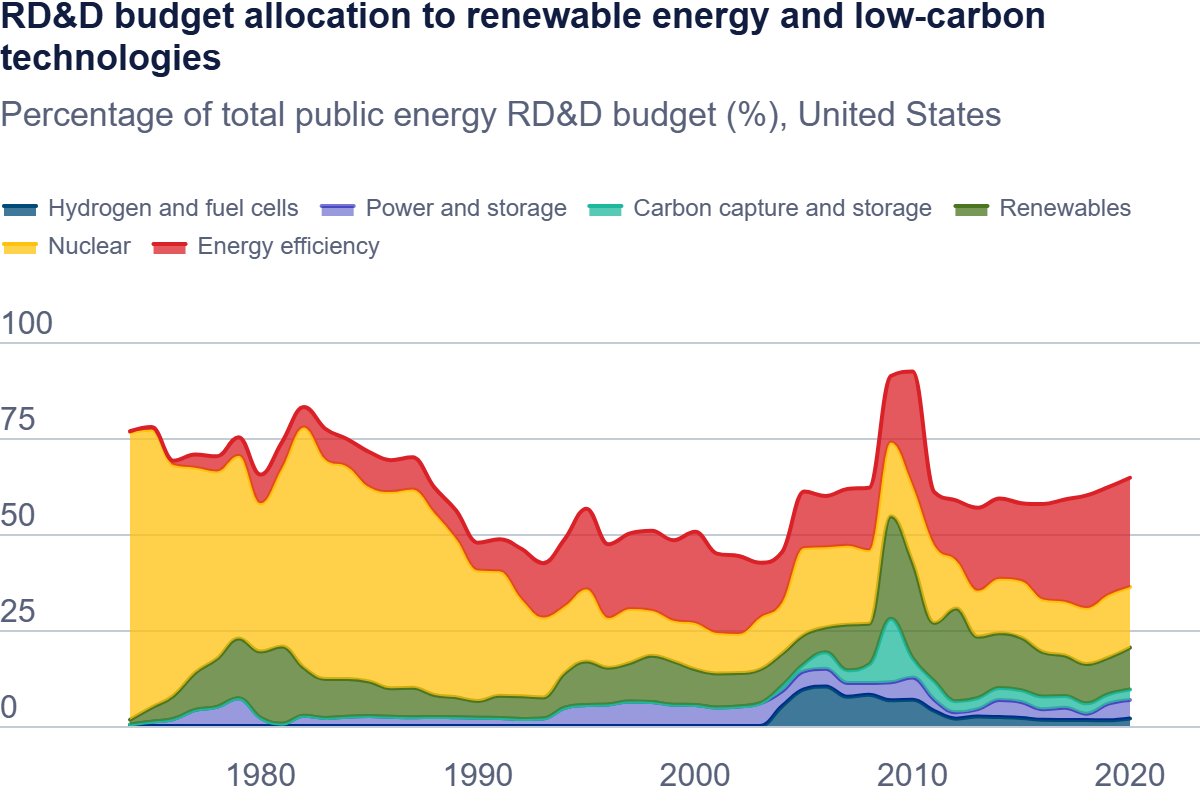
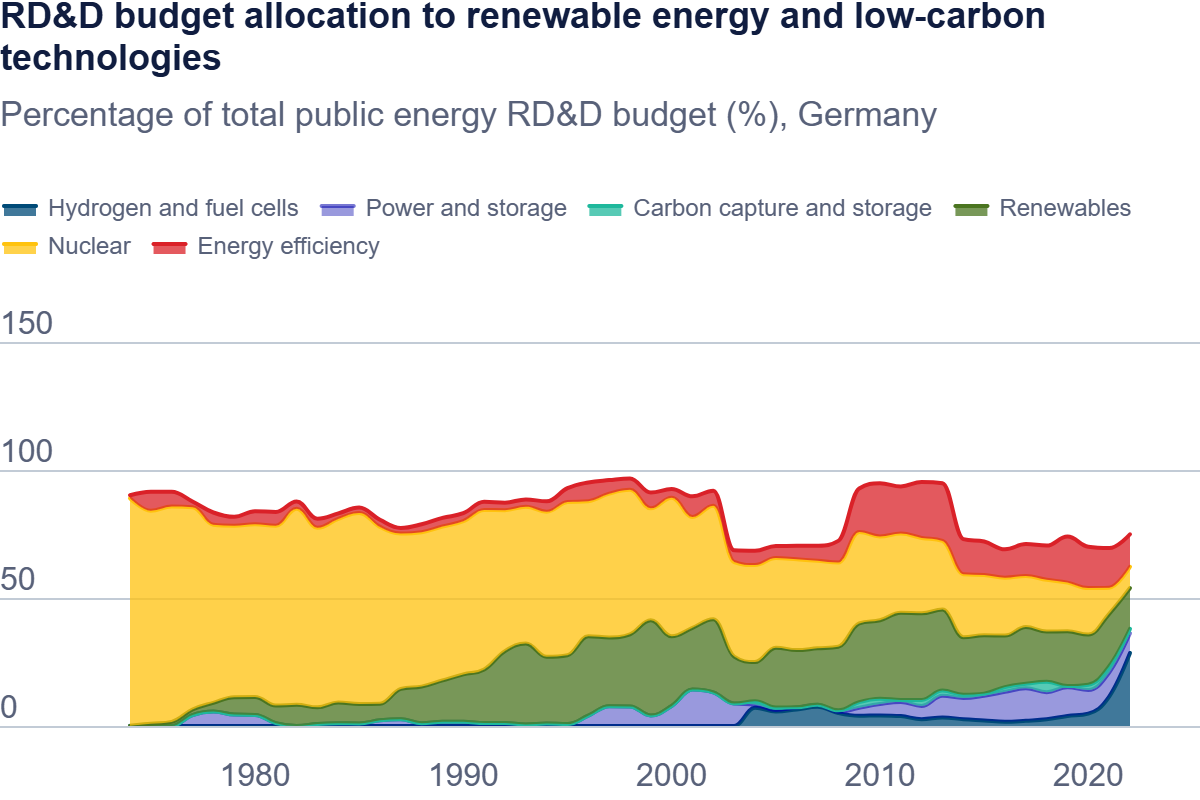
OECDのデータで確認できる1970年代から1990年までは日本のみならず、米国、ドイツもエネルギー投資に関してはほぼ原子力となっており長年にわたって手厚かった事が伺えます。米国は1990年、ドイツも2000年以降は原子力から他の分野への投資にシフトしております。日本は現在も原発への依存度が高いものの2010年以降は再生可能エネルギーや他のエネルギー関連技術への投資にシフトしてきている事が読み取れます。
| Energy efficiency | Nuclear | Renewable energy | |
|---|---|---|---|
| Japan | 25.6% | 34.4% | 14.7% |
| U.S. | 28.1% | 16.3% | 10.9% |
| Germany | 12.7% | 8.3% | 15.9% |
**********
OECDの”Climate Action Dashboard” は英語版とフランス語版がございます。本統計データの構成は下記の通りです。(なおリンクは全て英語版となっております。)
- Overview (概要)
- 1. Progress on climate action (気候変動対策の進捗状況)
- 2. Key Global Indicators (主要な世界指標)
- Net-Zero (ネットゼロ)
- GHG Emissions and targets (温室効果ガス排出量と目標)
- Annual Temperature Change (年間気温変化)
- Climate mitigation policies (気候変動緩和政策)
- Emissions (排出量)
- 3. GHG emission trends and trajectories (温室効果ガス排出量の傾向と軌跡)
- Greenhouse gas emissions (温室効果ガス排出量)
- Greenhouse gas emissions and 2030 target of Nationally Determined Contributions (NDC) (温室効果ガス排出量と 2030 年の国別貢献 (NDC) 目標)
- Greenhouse gas emissions and EU Effort Sharing Regulation target (温室効果ガス排出量と EU 努力分担規制目標)
- Annual difference between GHG emissions and NDC 2030 target (温室効果がす排出量とNDC2030目標の年間差異)
- Annual difference between ESR sector emissions and ESR target (ESRセクター排出量とESR目標の年間差異)
- 4. GHG Emissions intensities trends (温室効果ガス排出強度の傾向)
- GHG emission intensity per GDP (GDPあたりの温室効果ガス排出強度)
- GHG emissions per capita (一人あたりの温室効果ガス排出量)
- 5. GHG emissions by source (発生源別の温室効果ガス排出量)
- GHG emission intensity per GDP (GDPあたりの温室効果ガス排出強度)
- GHG emissions per capita (一人あたりの温室効果ガス排出量)
- 6. Production- and demand-based GHG emissions (生産および需要ベースの温室効果ガス排出量)
- Production- and demand-based GHG emissions (生産および需要ベースの温室効果ガス排出量)
- Production- and demand-based GHG intensity, energy-related GHG per capita (生産および需要ベースの温室効果ガス強度、一人あたりのエネルギー由来温室効果ガス)
- Production- and demand-based GHG productivity, GDP per unit of energy-related GHG emissions (生産および需要ベースの温室効果ガス生産性、エネルギー由来の温室効果ガス排出量単位あたりのGDP)
- 3. GHG emission trends and trajectories (温室効果ガス排出量の傾向と軌跡)
- Drivers (要因)
- 7. Energy use: production, supply and consumption (エネルギー使用: 生産、供給、消費)
- Total energy supply by source (発生源別の総エネルギー供給量)
- Energy intensity per capita (エネルギー一人当たりの強度)
- Energy productivity (エネルギー生産性)
- Electricity generation by source (発電源別発電量)
- 8. Material use (原材料使用)
- Material consumption trends (原材料消費のトレンド)
- Material consumption per capita ((一人当たりの原材料消費量)
- Material consumption per GDP (GDP当たりの原材料消費量)
- 9. Land use and cover (土地利用と土地被覆)
- Land cover change (no data available) (土地被覆の変化(データなし))
次のリンクにアクセスして下さい: Land Cover Change and Conversions (土地被覆の変化と転換) 2018年5月24日発行. PDFのダウンロードはこちらになります
- Land cover change (no data available) (土地被覆の変化(データなし))
- 10. Transport & mobility (交通とモビリティ)
- Passenger car stock per 1000 inhabitants (1000人当たりの乗用車保有台数)
- EV passenger cars sales and share of total passenger cars sales (EV乗用車販売台数と乗用車販売台数全体に占める割合)
- 11. General economic drivers (一般的な経済要因)
- Decoupling of CO2 emissions and growth (CO2排出量と成長の分離)
- 7. Energy use: production, supply and consumption (エネルギー使用: 生産、供給、消費)
- Impact & risks (影響とリスク)
- 12. Impacts on climate and environmental conditions (気候と環境条件への影響)
- Annual temperature change (年間気温の変化)
- Annual precipitation change (年間降水量の変化)
- 13. Climate-related hazards and vulnerabilities (気候関連の危険性と脆弱性)
- Population exposure to hot days (暑い日にさらされる人口)
- Population exposure to icing days (氷結日にさらされる人口)
- Cropland exposure to extreme precipitation events (極端な降水に見舞われる農地)
- Cropland exposure to drought (干ばつに見舞われる農地)
- Forest exposure to wildfire danger (山火事の危険にさらされている森林)
- Built-up area exposure to violent windstorms (激しい暴風雨にさらされる市街地エリア)
- Population exposure to river flooding (河川洪水の影響を受ける人口)
- Population exposure to coastal flooding (沿岸地域の洪水の影響を受ける人口)
- 12. Impacts on climate and environmental conditions (気候と環境条件への影響)
- Actions & opportunities (行動と機会)
- 14. Climate policies (気候政策)
- Policy adoption by instrument type (政策採用、種類別)
- Policy adoption by area (政策採用、地域別)
- 15. Market-based Instruments (市場ベースの手段)
- Policy adoption by instrument type (Market-based instruments) (種類別の政策採用 (市場ベースの手段))
- Policy in place (Market-based instruments) (実施されている政策 (市場ベースの手段))
- Net Effective Carbon Rate (ECR) by sector (セクター別の純実効炭素税率 (ECR))
- Environmentally related tax revenue as percentage of total tax revenue (%) (総税収に対する環境関連税収の割合 (%))
- RD&D budget allocation to renewable energy and low-carbon technologies (再生可能エネルギーと低炭素技術への研究開発予算の割り当て)
- 16. Non-Market Based Instruments (非市場ベースの手段)
- Policy adoption by instrument type (Non-market-based instruments) (種類別の政策採用 (非市場ベースの手段))
- Policies in place (Non-market-based instruments) (実施されている政策 (非市場ベースの手段))
- MEPS for electric motors (電動モーターの MEPS: Minimum Energy Performance Standard (最低エネルギー消費効率基準))
- Development of environment-related technologies (環境関連技術の開発)
- Protected terrestrial area (保護された陸上領域)
- 17. Targets, international co-operation, governance, and climate data (目標、国際協力、ガバナンス、気候データ
- Policy adoption by instrument type (Targets, governance, climate data and international co-operation) (種類別の政策採用 (目標、ガバナンス、気候データ、国際協力))
- Policies in place (Targets, governance, climate data and international co-operation) (実施されている政策 (目標、ガバナンス、気候データ、国際協力))
- Aid to climate change adaptation and mitigation by donor country (ドナー国による気候変動適応と緩和への援助)
- International initiatives joined (参加している国際的イニシアチブ)
- Annual funding for climate advisory body (気候諮問機関への年間資金提供)
- 14. Climate policies (気候政策)
**********
謝辞: これらの統計とデータを提供してくれたOECDに感謝の意を表します。
太陽光に関するご相談、資料請求、
お見積依頼はこちらまで